3D Light-cone Visualisation
scripts/plot_lightcone_3d.py
Overview
This script converts each galaxy’s (RA, DEC, z) into a comoving Cartesian position and renders two complementary figures:
3D perspective scatter — a Matplotlib
Axes3Dscatter on a dark background, coloured by redshift with the turbo colormap. Thin circular rings in the equatorial plane mark comoving distance shells at \(z = 0.1, 0.2, \ldots\).Top-down projection — the same dataset projected onto the \(x\)–\(y\) plane (equatorial comoving coordinates), also coloured by redshift. Because it is a pure 2D scatter, this companion figure is always sharp and well-resolved, complementing the 3D view.
An optional interactive HTML figure (Plotly) can be produced with
--interactive.
Coordinate conversion
Each galaxy at right ascension \(\alpha\), declination \(\delta\), and redshift \(z\) is mapped to comoving Cartesian coordinates:
where \(d_C(z)\) is the comoving distance in Mpc computed with the Planck 2018 flat ΛCDM cosmology (\(H_0 = 67.4\,\text{km\,s}^{-1}\text{Mpc}^{-1}\), \(\Omega_m = 0.315\)).
Supported catalogues
Key |
FITS file |
RA col |
DEC col |
z col |
z range |
|---|---|---|---|---|---|
|
|
|
|
|
0.01 – 0.36 |
|
|
|
|
|
0.002 – 0.50 |
|
|
|
|
|
0.005 – 0.30 |
|
|
|
|
|
0.01 – 0.50 |
|
|
|
|
|
0.01 – 0.50 |
Quality cuts applied to every catalogue: RA ∈ [0°, 360°], DEC ∈ [−90°, 90°],
\(z > 0\), and ZWARNING = 0 where that column exists.
Usage
# All five surveys, default settings
python scripts/plot_lightcone_3d.py

# DESI NGC + SGC only, up to z = 0.45, 100 000 points per survey
python scripts/plot_lightcone_3d.py \
    --surveys DESI_NGC DESI_SGC --zmax 0.45 --max-points 100000

# Custom viewing angle
python scripts/plot_lightcone_3d.py \
    --surveys DESI_NGC DESI_SGC --elev 25 --azim 30

# Also write an interactive Plotly HTML file
python scripts/plot_lightcone_3d.py \
    --surveys DESI_NGC DESI_SGC --interactive
Command-line options
Option |
Default |
Description |
|---|---|---|
|
all five |
Space-separated list of catalogue keys.
Choices: |
|
|
Maximum redshift included. |
|
|
Maximum galaxies per survey (random downsampling when exceeded). |
|
|
Elevation angle for the 3D perspective view [degrees]. |
|
|
Azimuth angle for the 3D perspective view [degrees]. |
|
(flag) |
Also write a Plotly interactive HTML alongside the PNG
(requires |
|
|
Random seed for downsampling. |
|
|
Directory where output files are written. |
Output files
3D perspective PNG
lightcone_3d_{SURVEYS}_zmax{Z:.2f}.png
Example: lightcone_3d_DESI_NGC+DESI_SGC_zmax0.45.png
Top-down projection PNG
lightcone_topdown_{SURVEYS}_zmax{Z:.2f}.png
Example: lightcone_topdown_DESI_NGC+DESI_SGC_zmax0.45.png
Interactive HTML (optional)
lightcone_3d_{SURVEYS}_zmax{Z:.2f}_interactive.html
Example outputs
3D perspective — DESI DR1 BGS NGC + SGC
100 000 galaxies per survey placed at their comoving Cartesian positions. The conical footprint of the Northern Galactic Cap (right) and the more isotropic Southern Galactic Cap (left) are clearly distinguishable. Distance shells at \(z = 0.1, 0.2, 0.3, 0.4\) are drawn in the equatorial plane for reference.
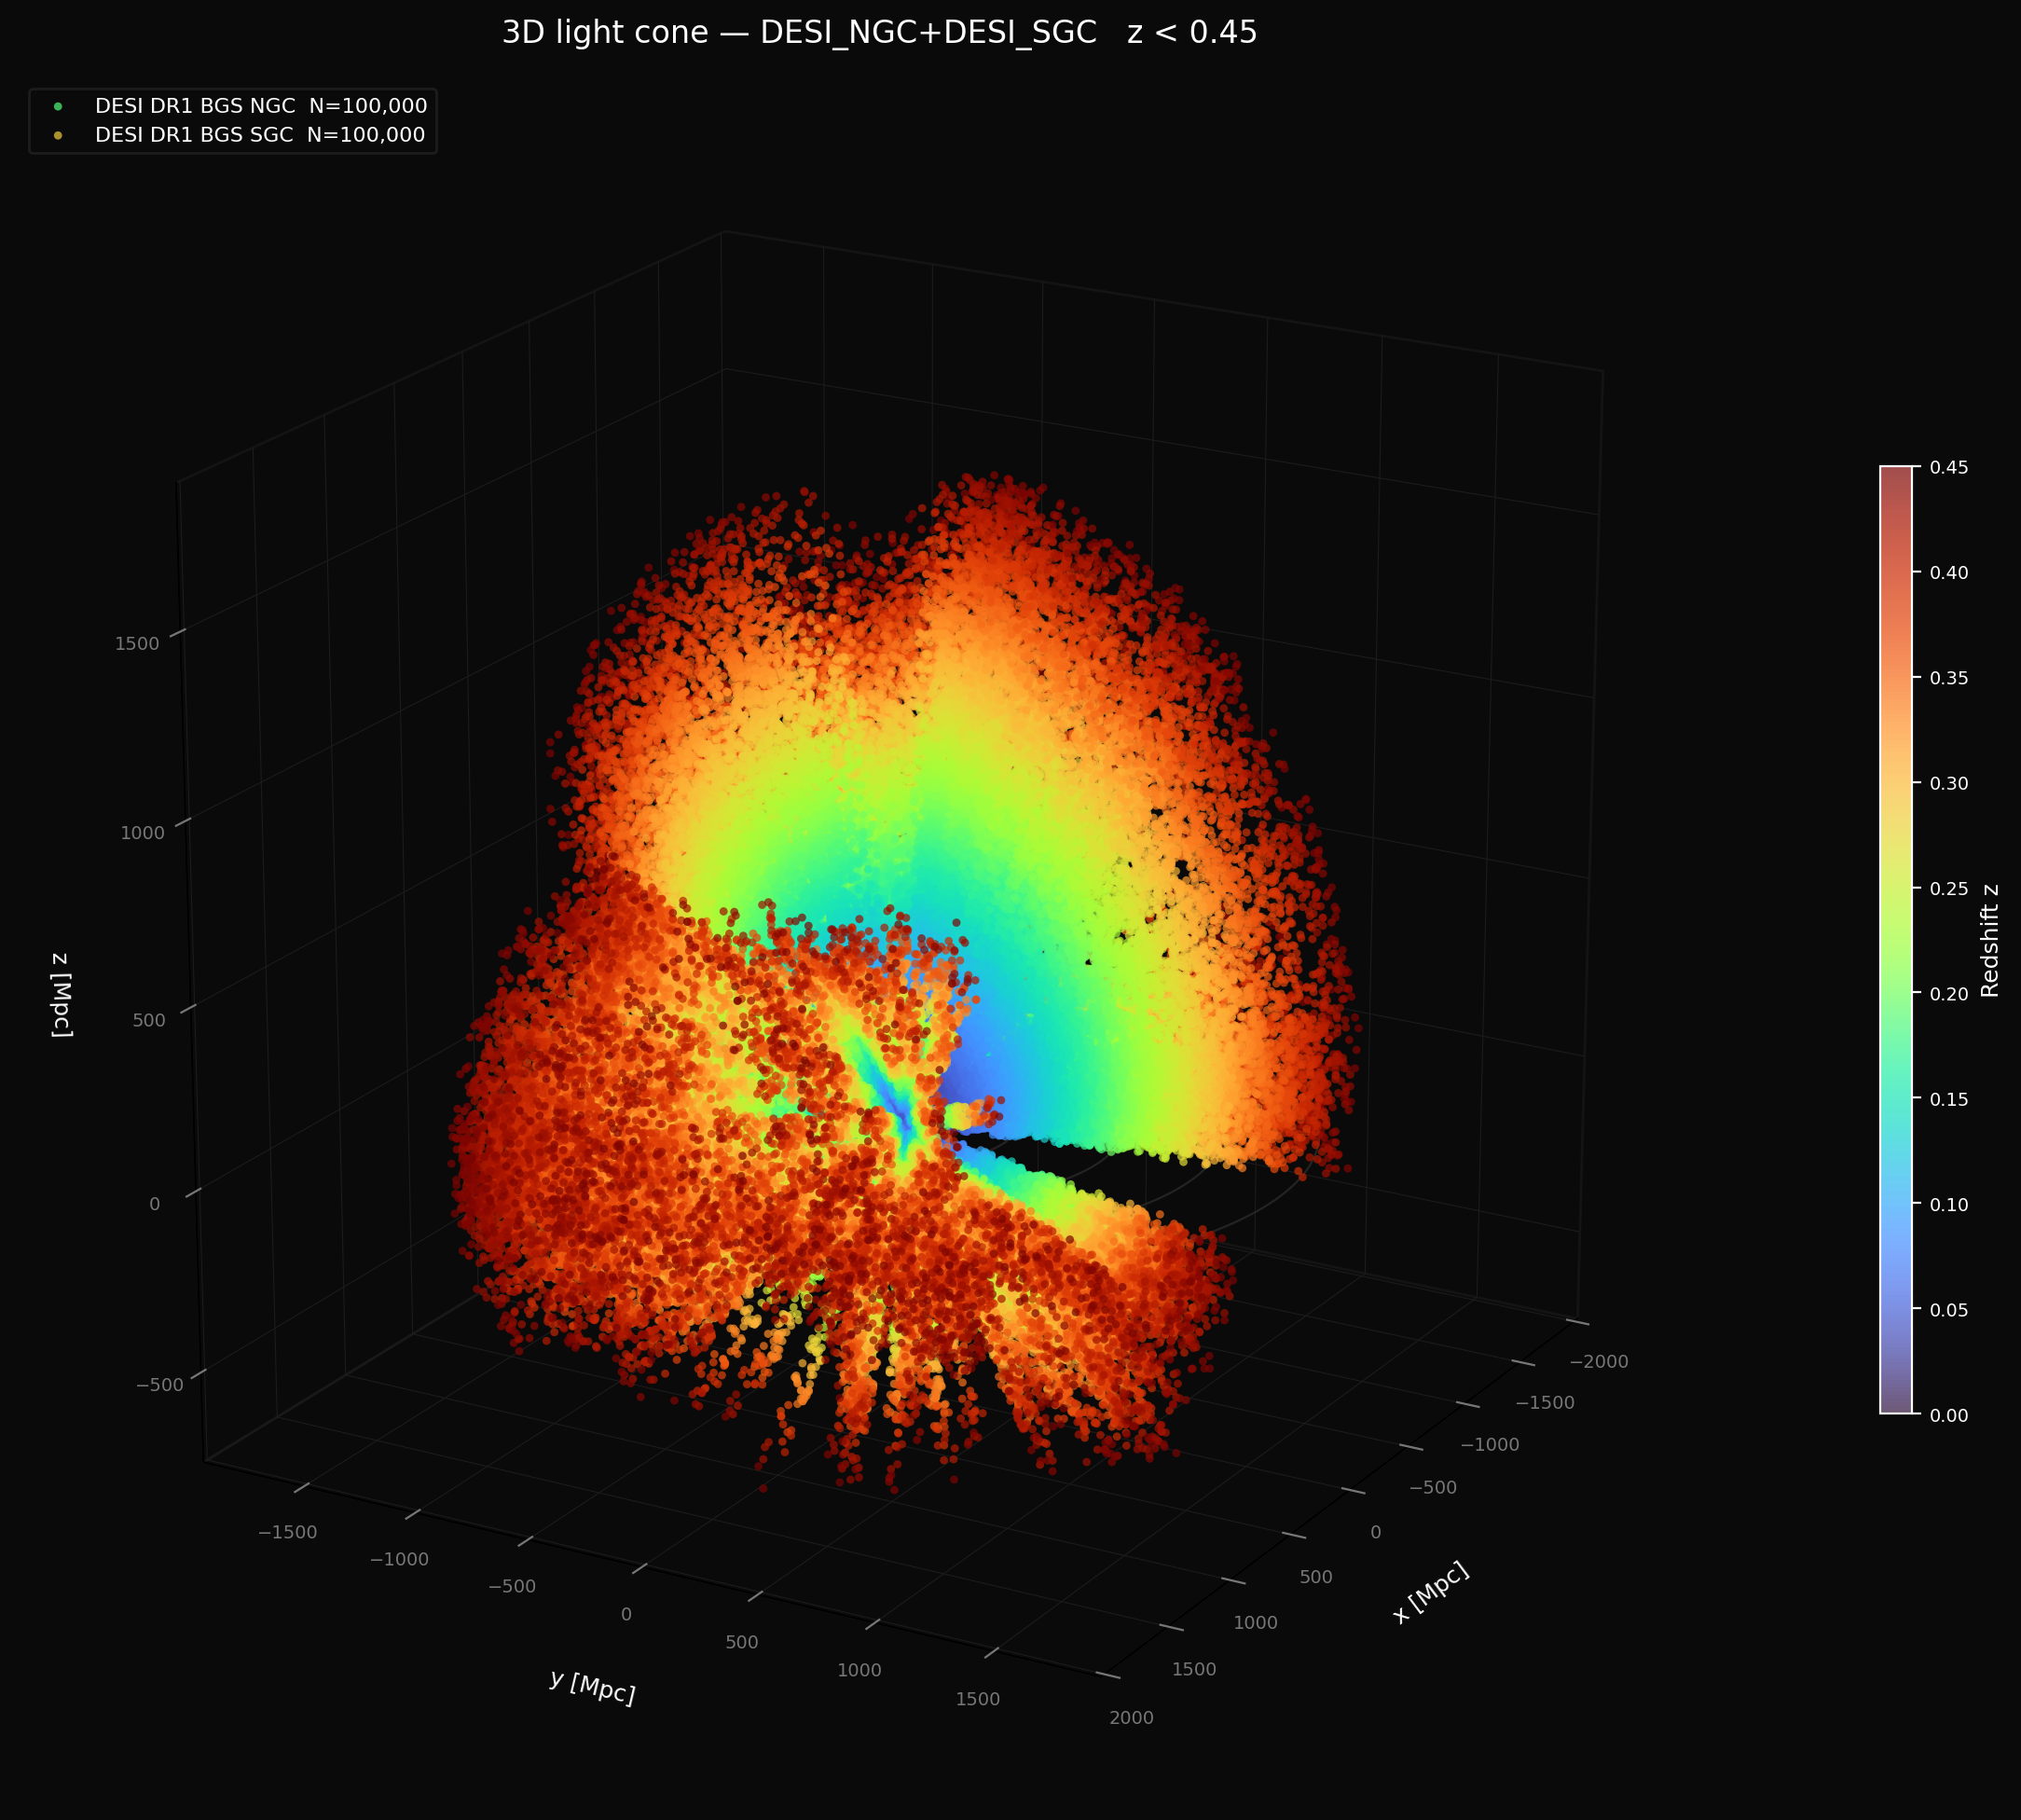
3D comoving light cone. Blue–yellow–red: redshift 0 → 0.45 (turbo colormap). The NGC cone (RA = 90°–298°, DEC > 0°) appears as the dominant cluster of points in the upper hemisphere; the SGC fills the southern and equatorial regions.
Top-down projection — DESI DR1 BGS NGC + SGC
The same dataset projected onto the \(x\)–\(y\) plane (RA-projected comoving coordinates). This 2D view reveals the full sky coverage and the large-scale density contrasts with higher clarity than the 3D scatter.
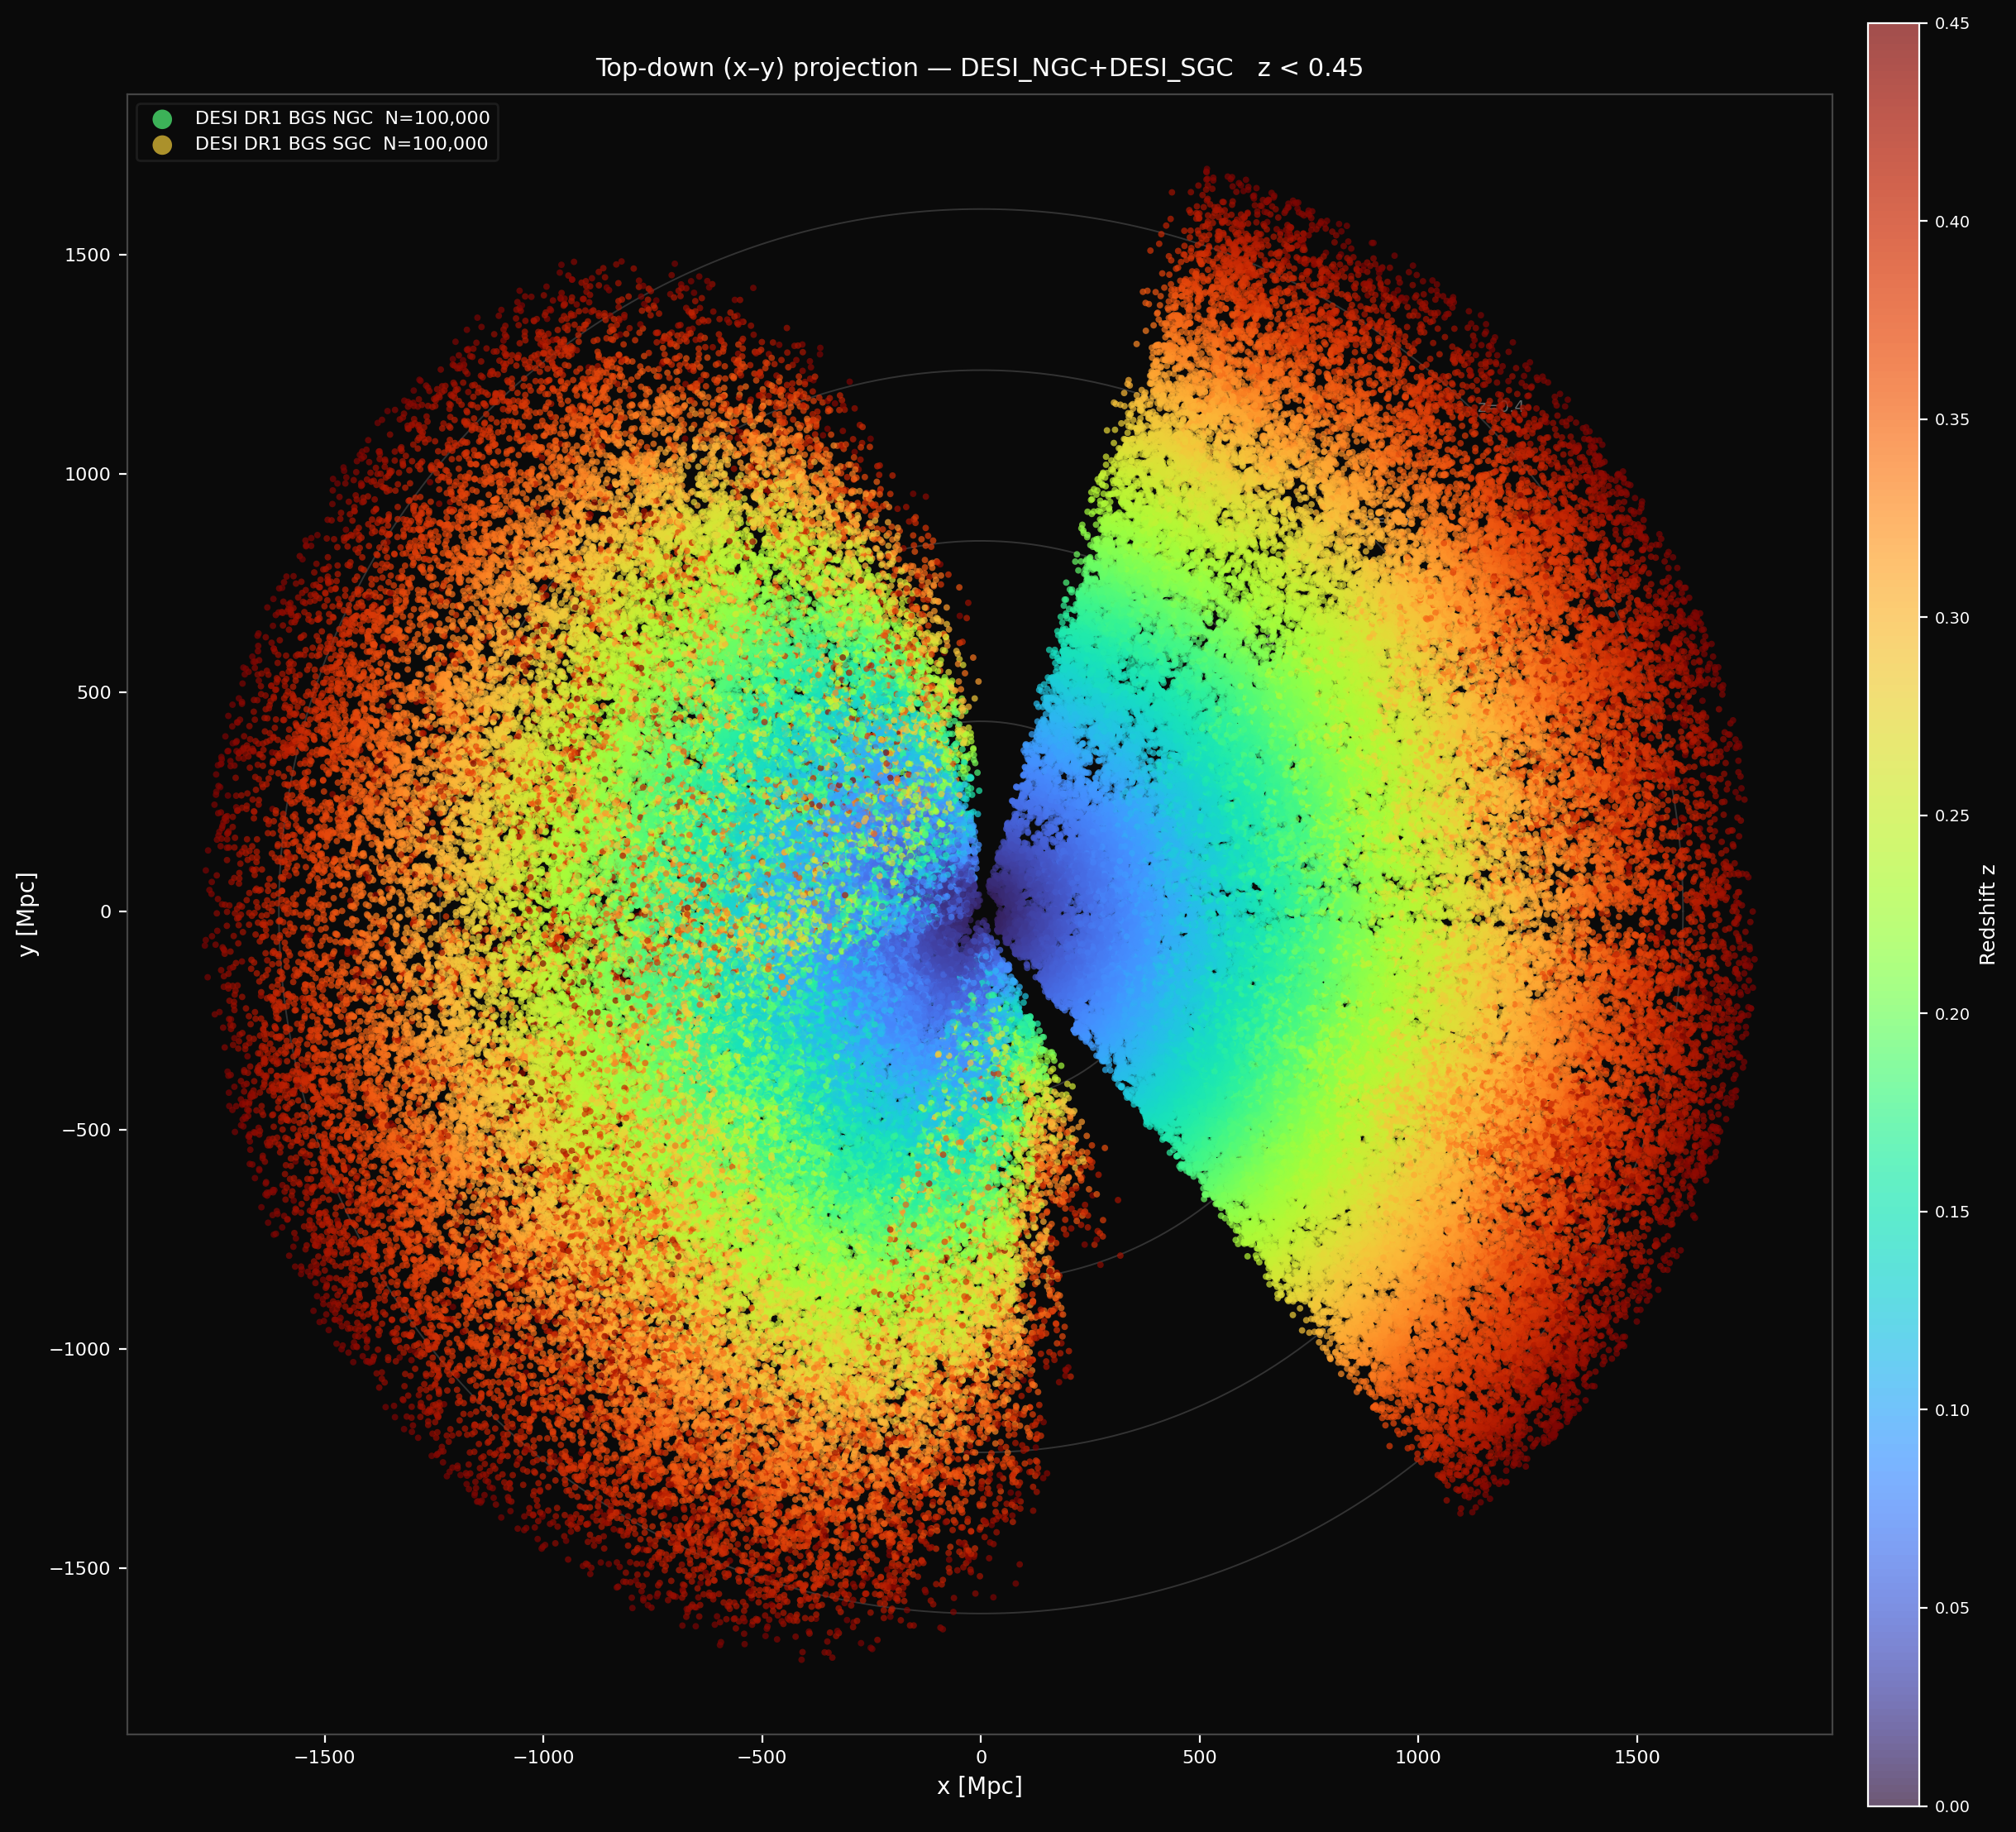
Top-down projection (\(x\)–\(y\) comoving plane). The partial sky coverage of DESI DR1 BGS is clearly visible: the NGC occupies roughly the upper-left quadrant and the SGC the remaining area. The colour gradient from violet (low-z) to red (high-z) traces the increasing comoving volume with distance.