BGS VLIM M★ LS10 — Run Summary
Summary statistics for the DESI Bright Galaxy Survey (BGS) volume-limited
stellar-mass samples from Legacy Survey DR10 (LS10).
The pipeline is measure_BGS_VLIM_Mstar.ipynb for individual statistics
and joint_smf_wprp_deltasigma_covariance.ipynb for the joint covariance.
Cosmology: Planck18 (H₀ = 67.4, Ω_m = 0.315)
Survey area: ~18 950 deg² (computed from randoms via HEALPix nside=64; varies ±300 deg² across samples).
Redshift column: BEST_Z.
Stellar mass column: LPH_MASS_BEST (log₁₀ M★/M☉).
Weight variants
Every statistic is computed three times:
Variant |
Column |
Description |
|---|---|---|
|
1 |
No systematic correction; volume-limited sample is complete |
|
|
Additive contamination model (Berlfein+2024 Eq. 11) |
|
|
Combined additive + multiplicative model |
Weights are pre-computed by
sys_mapping/scripts/compute_sys_weights.py (separate mamba environment)
and stored in SYS_WEIGHTS_DIR/{sample_id}_NSIDE0064_WEIGHTS.fits.
Sample inventory — individual statistics
Sample ID |
N_gal |
z_max |
log₁₀M★_min |
w(θ) |
wp |
SMF |
Cℓ |
ΔΣ-HSC |
ΔΣ-DES |
|---|---|---|---|---|---|---|---|---|---|
LS10_VLIM_ANY_9.0 z<0.08 |
523 486 |
0.08 |
9.0 |
✓ |
✓ |
✓ |
✓ |
✓ |
— |
LS10_VLIM_ANY_9.5 z<0.12 |
1 432 502 |
0.12 |
9.5 |
✓ |
✓ |
✓ |
✓ |
✓ |
— |
LS10_VLIM_ANY_10.0 z<0.18 |
2 759 238 |
0.18 |
10.0 |
✓ |
✓ |
✓ |
✓ |
✓ |
✓ |
LS10_VLIM_ANY_10.25 z<0.22 |
3 308 841 |
0.22 |
10.25 |
— |
— |
— |
— |
— |
— |
LS10_VLIM_ANY_10.5 z<0.26 |
3 263 228 |
0.26 |
10.5 |
— |
— |
— |
— |
— |
— |
LS10_VLIM_ANY_10.75 z<0.31 |
2 802 710 |
0.31 |
10.75 |
✓ |
— |
— |
✓ |
— |
— |
LS10_VLIM_ANY_11.0 z<0.35 |
1 619 838 |
0.35 |
11.0 |
✓ |
✓ |
✓ |
✓ |
✓ |
— |
LS10_VLIM_ANY_11.25 z<0.35 |
541 855 |
0.35 |
11.25 |
✓ |
✓ |
✓ |
✓ |
✓ |
— |
LS10_VLIM_ANY_11.5 z<0.35 |
120 882 |
0.35 |
11.5 |
✓ |
✓ |
✓ |
✓ |
✓ |
✓ |
SMF = three estimators per sample: 1/Vmax, SWML, C⁻ (see below). w(θ), wp, SMF all computed for all three weight variants where marked ✓. w(θ) for 10.75 is uniform-only. ΔΣ-HSC for 10.75, 10.25, 10.5 pending; ΔΣ-DES available for 10.0 and 11.5 (uniform only).
Sample inventory — joint covariance (SMF + wp + ΔΣ)
Output dir |
log₁₀M★_min |
z_max |
N_JK |
n_SMF bins |
n_wp bins |
n_ΔΣ bins |
Source |
|---|---|---|---|---|---|---|---|
BGS_Mstar9.00 |
9.00 |
0.08 |
100 |
14 |
10 |
10 |
HSC Y3 |
BGS_Mstar9.50 |
9.50 |
0.12 |
100 |
12 |
10 |
10 |
HSC Y3 |
BGS_Mstar10.00 |
10.00 |
0.18 |
100 |
10 |
10 |
10 |
HSC Y3 |
BGS_Mstar11.00 |
11.00 |
0.35 |
100 |
6 |
10 |
10 |
HSC Y3 |
BGS_Mstar11.25 |
11.25 |
0.35 |
100 |
5 |
10 |
10 |
HSC Y3 |
BGS_Mstar11.50 |
11.50 |
0.35 |
100 |
4 |
10 |
10 |
HSC Y3 |
Output files
data/
├── twopcf/{key}-wtheta[{-variant}].h5           w(θ)
├── twopcf/{key}-wp-pimax100[{-variant}].h5       w_p(r_p)
├── lf_smf/{key}-smf-vmax[{-variant}].h5          SMF 1/Vmax
├── lf_smf/{key}-smf-swml[{-variant}].h5          SMF SWML
├── lf_smf/{key}-smf-cminus[{-variant}].h5        SMF C⁻ cumulative
├── lensing/{key}-dsigma-HSC[{-variant}].h5       ΔΣ  HSC Y3
├── lensing/{key}-dsigma-DES[{-variant}].h5       ΔΣ  DES Y3
├── powspec/{key}-cl[{-variant}].h5               C_ℓ  pseudo-Cl
└── BGS_Mstar{mmin}/
    ├── joint_smf_wprp_deltasigma.h5              uniform weights
    ├── joint_smf_wprp_deltasigma-sys-add.h5      additive sys. weights
    └── joint_smf_wprp_deltasigma-sys-comb.h5     combined sys. weights

data/summary.yaml    — all output paths + Schechter fit scalars
Stellar mass function
Three estimators are computed for each BGS sample and each weight variant.
1/Vmax (Schmidt 1968) — the primary estimator. Each galaxy contributes \(w_i / (V_{\max,i}\,\Delta M_*)\) to its mass bin, where \(V_{\max,i}\) is the comoving volume over which galaxy i would remain in the sample. Jackknife covariance from NJK = 100 spatial regions.
SWML (Efstathiou, Ellis & Peterson 1988) — step-wise maximum likelihood. The accessibility matrix Hik = ΔMk if bin k is observable at galaxy i’s redshift, else 0. The SWML φk is solved by fixed-point iteration and normalised to match the 1/Vmax total density.
C⁻ (Lynden-Bell 1971) — non-parametric cumulative Φ(>M★) via the product recursion over galaxies sorted high-to-low in M★. Binned onto the 0.25 dex grid and normalised to 1/Vmax.
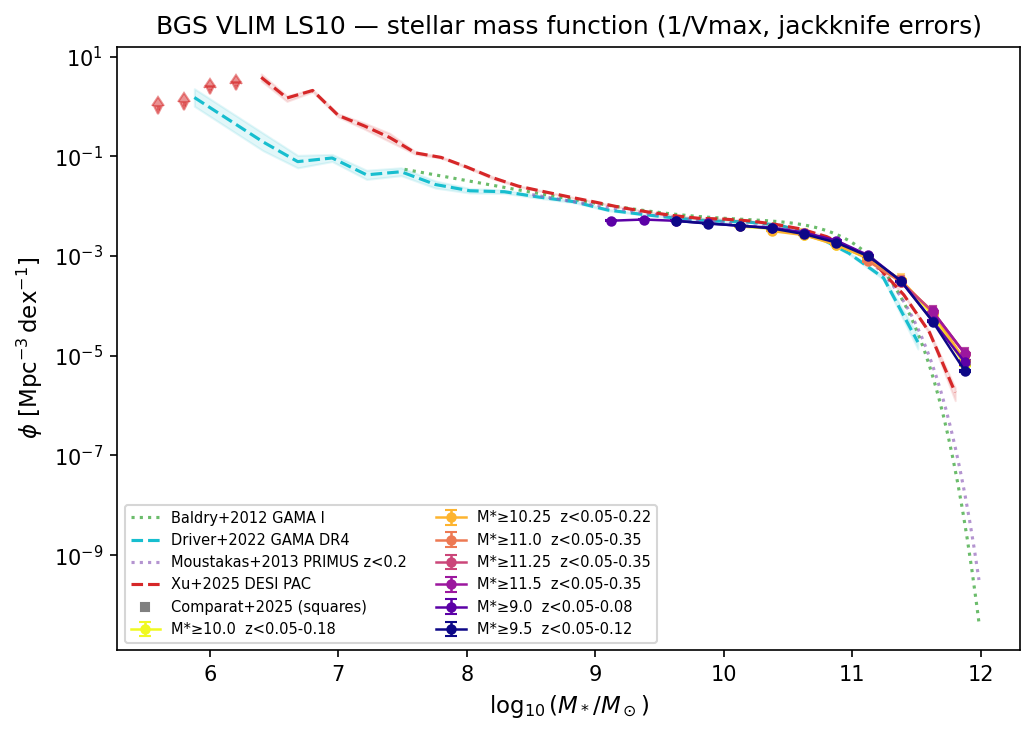
Stellar mass function φ(M★) for the available BGS VLIM samples, estimated with 1/Vmax (coloured markers with jackknife errors). Bins: 0.25 dex spacing, log₁₀(M★/M☉) ∈ [9.0, 12.5]. Literature references overlaid: Baldry+2012 GAMA I (double Schechter), Driver+2022 GAMA DR4 (1/Vmax), Moustakas+2013 PRIMUS z<0.2, Xu+2025 DESI PAC (shaded band). See Literature Benchmarks for provenance.
SMF key values at the lowest complete stellar mass bin (uniform weights, jackknife covariance):
Sample |
log₁₀M★_min |
z_max |
log₁₀M★_ref [dex] |
φ [Mpc⁻³ dex⁻¹] |
|---|---|---|---|---|
LS10_VLIM_ANY_9.0 |
9.0 |
0.08 |
9.12 |
5.10 × 10⁻³ ± 1.8 × 10⁻⁵ |
LS10_VLIM_ANY_9.5 |
9.5 |
0.12 |
9.62 |
5.06 × 10⁻³ ± 9.0 × 10⁻⁶ |
LS10_VLIM_ANY_10.0 |
10.0 |
0.18 |
10.12 |
3.91 × 10⁻³ ± 4.3 × 10⁻⁶ |
LS10_VLIM_ANY_10.25 |
10.25 |
0.22 |
(pending) |
(pending) |
LS10_VLIM_ANY_10.5 |
10.5 |
0.26 |
(pending) |
(pending) |
LS10_VLIM_ANY_10.75 |
10.75 |
0.31 |
(pending) |
(pending) |
LS10_VLIM_ANY_11.0 |
11.0 |
0.35 |
11.12 |
7.80 × 10⁻⁴ ± 7.5 × 10⁻⁷ |
LS10_VLIM_ANY_11.25 |
11.25 |
0.35 |
11.38 |
3.06 × 10⁻⁴ ± 4.7 × 10⁻⁷ |
LS10_VLIM_ANY_11.5 |
11.5 |
0.35 |
11.62 |
7.76 × 10⁻⁵ ± 1.1 × 10⁻⁶ (joint JK) |
Schechter fits
Three parametric fits are stored in data/summary.yaml per sample
and weight variant:
STY (
fit_schechter_smf_sty()) — unbinned maximum likelihood on the observed M★ distribution; JAX L-BFGS-B with Hessian covariance. Returns (log₁₀ φ★, log₁₀ M★★, α).Single Schechter χ² (
fit_smf_schechter()) — fits the 1/Vmax bins including an Eddington-bias convolution forward model (Zalesky+2025 Eq. 11, σ_M★ = 0.2 dex).Double Schechter χ² (
fit_smf_double_schechter()) — same forward model, two Schechter components (five free parameters).
Angular correlation function w(θ)
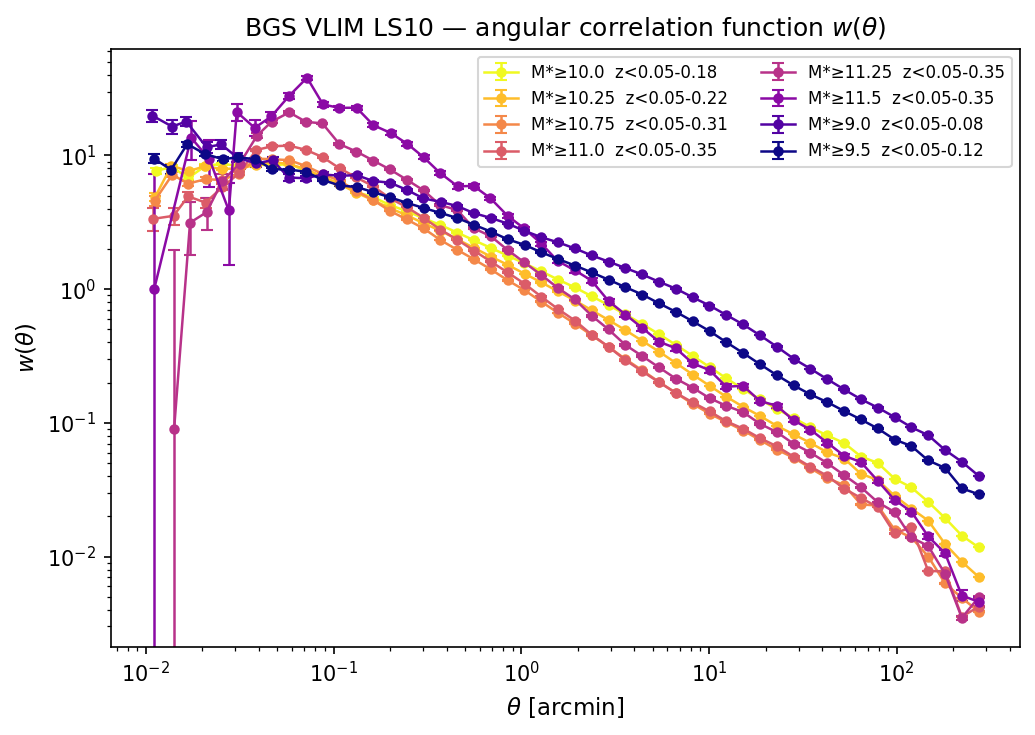
Angular two-point correlation function w(θ) for BGS VLIM samples (uniform weight variant). Bins: 30 log-spaced bins in [0.01, 60] arcmin. Error bars are TreeCorr variance estimates.
Projected correlation function wp(rp)
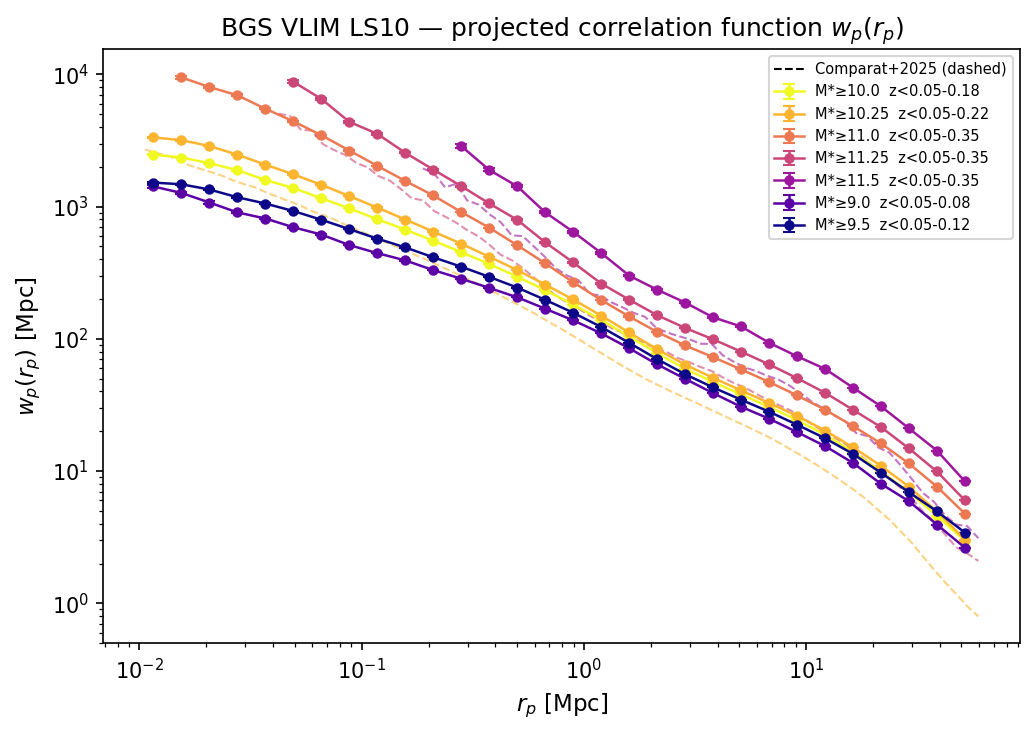
Projected correlation function wp(rp) for the available BGS samples (uniform weights, πmax = 100 Mpc), measured with Corrfunc Landy-Szalay. Bins: 30 log-spaced bins in [0.01, 60] Mpc (individual stat files) or 10 bins in [0.03, 30] Mpc (joint covariance files).
Representative wp(rp) values at rp ≈ 1 Mpc and ≈ 10 Mpc (uniform weights; nearest available bin is rp = 0.90 Mpc and 9.11 Mpc for the 30-bin files). Errors are TreeCorr variance (negligible for large N); jackknife errors from joint covariance files where available (marked “JK”):
Sample |
log₁₀M★_min |
wp(0.90 Mpc) [Mpc] |
wp(9.11 Mpc) [Mpc] |
|---|---|---|---|
LS10_VLIM_ANY_9.0 |
9.0 |
138.0 ± 0.1 |
19.7 ± 0.0 |
LS10_VLIM_ANY_9.5 |
9.5 |
157.6 ± 0.1 |
22.4 ± 0.0 |
LS10_VLIM_ANY_10.0 |
10.0 |
181.6 ± 0.1 |
24.3 ± 0.0 |
LS10_VLIM_ANY_10.25 |
10.25 |
(pending) |
(pending) |
LS10_VLIM_ANY_10.5 |
10.5 |
(pending) |
(pending) |
LS10_VLIM_ANY_10.75 |
10.75 |
(pending) |
(pending) |
LS10_VLIM_ANY_11.0 |
11.0 |
268.1 ± 0.4 |
37.4 ± 0.0 |
LS10_VLIM_ANY_11.25 |
11.25 |
378.6 ± 1.7 |
50.4 ± 0.0 |
LS10_VLIM_ANY_11.5 |
11.5 |
645.6 ± 10.8 (28.3 JK) |
73.9 ± 0.2 (7.0 JK) |
Angular power spectrum Cℓ
Computed with cl_angular() (healpy pseudo-Cl, nside=512,
10 log-spaced ℓ bins in [2, 2000]). Available for 7 of 9 samples
(9.0, 9.5, 10.0, 10.75, 11.0, 11.25, 11.5); pending for 10.25 and 10.5.
Only the uniform weight variant is currently computed.
Galaxy–galaxy lensing ΔΣ(rp)
Measured with delta_sigma() (dsigma pipeline,
30 bins in [0.01, 60] Mpc).
HSC Y3 (primary): HSMRegauss shapes, 4 tomographic bins (mean-z per bin
from nz.fits), B-mode mask applied. Corrections: scalar shear response
+ HSM responsivity (1 − erms²).
DES Y3: Metacalibration shapes, 4 bins (bhat = 0–3), matrix shear + selection response corrections, MacCrann+2022 multiplicative bias.
Available lensing files per sample:
Sample |
log₁₀M★_min |
HSC uni |
HSC add |
HSC comb |
DES uni |
DES add |
DES comb |
|---|---|---|---|---|---|---|---|
LS10_VLIM_ANY_9.0 |
9.0 |
✓ |
✓ |
✓ |
— |
— |
— |
LS10_VLIM_ANY_9.5 |
9.5 |
✓ |
✓ |
✓ |
— |
— |
— |
LS10_VLIM_ANY_10.0 |
10.0 |
✓ |
— |
— |
✓ |
— |
— |
LS10_VLIM_ANY_10.25 |
10.25 |
— |
— |
— |
— |
— |
— |
LS10_VLIM_ANY_10.5 |
10.5 |
— |
— |
— |
— |
— |
— |
LS10_VLIM_ANY_10.75 |
10.75 |
— |
— |
— |
— |
— |
— |
LS10_VLIM_ANY_11.0 |
11.0 |
✓ |
✓ |
✓ |
— |
— |
— |
LS10_VLIM_ANY_11.25 |
11.25 |
✓ |
✓ |
✓ |
— |
— |
— |
LS10_VLIM_ANY_11.5 |
11.5 |
✓ |
✓ |
✓ |
✓ |
— |
— |
Joint SMF + wp + ΔΣ covariance
The joint data vector for the BGS run is
estimated with 100-region spatial jackknife resampling. The lensing source catalogue is HSC Y3 (shear estimator: HSMRegauss, 4 photo-z bins).
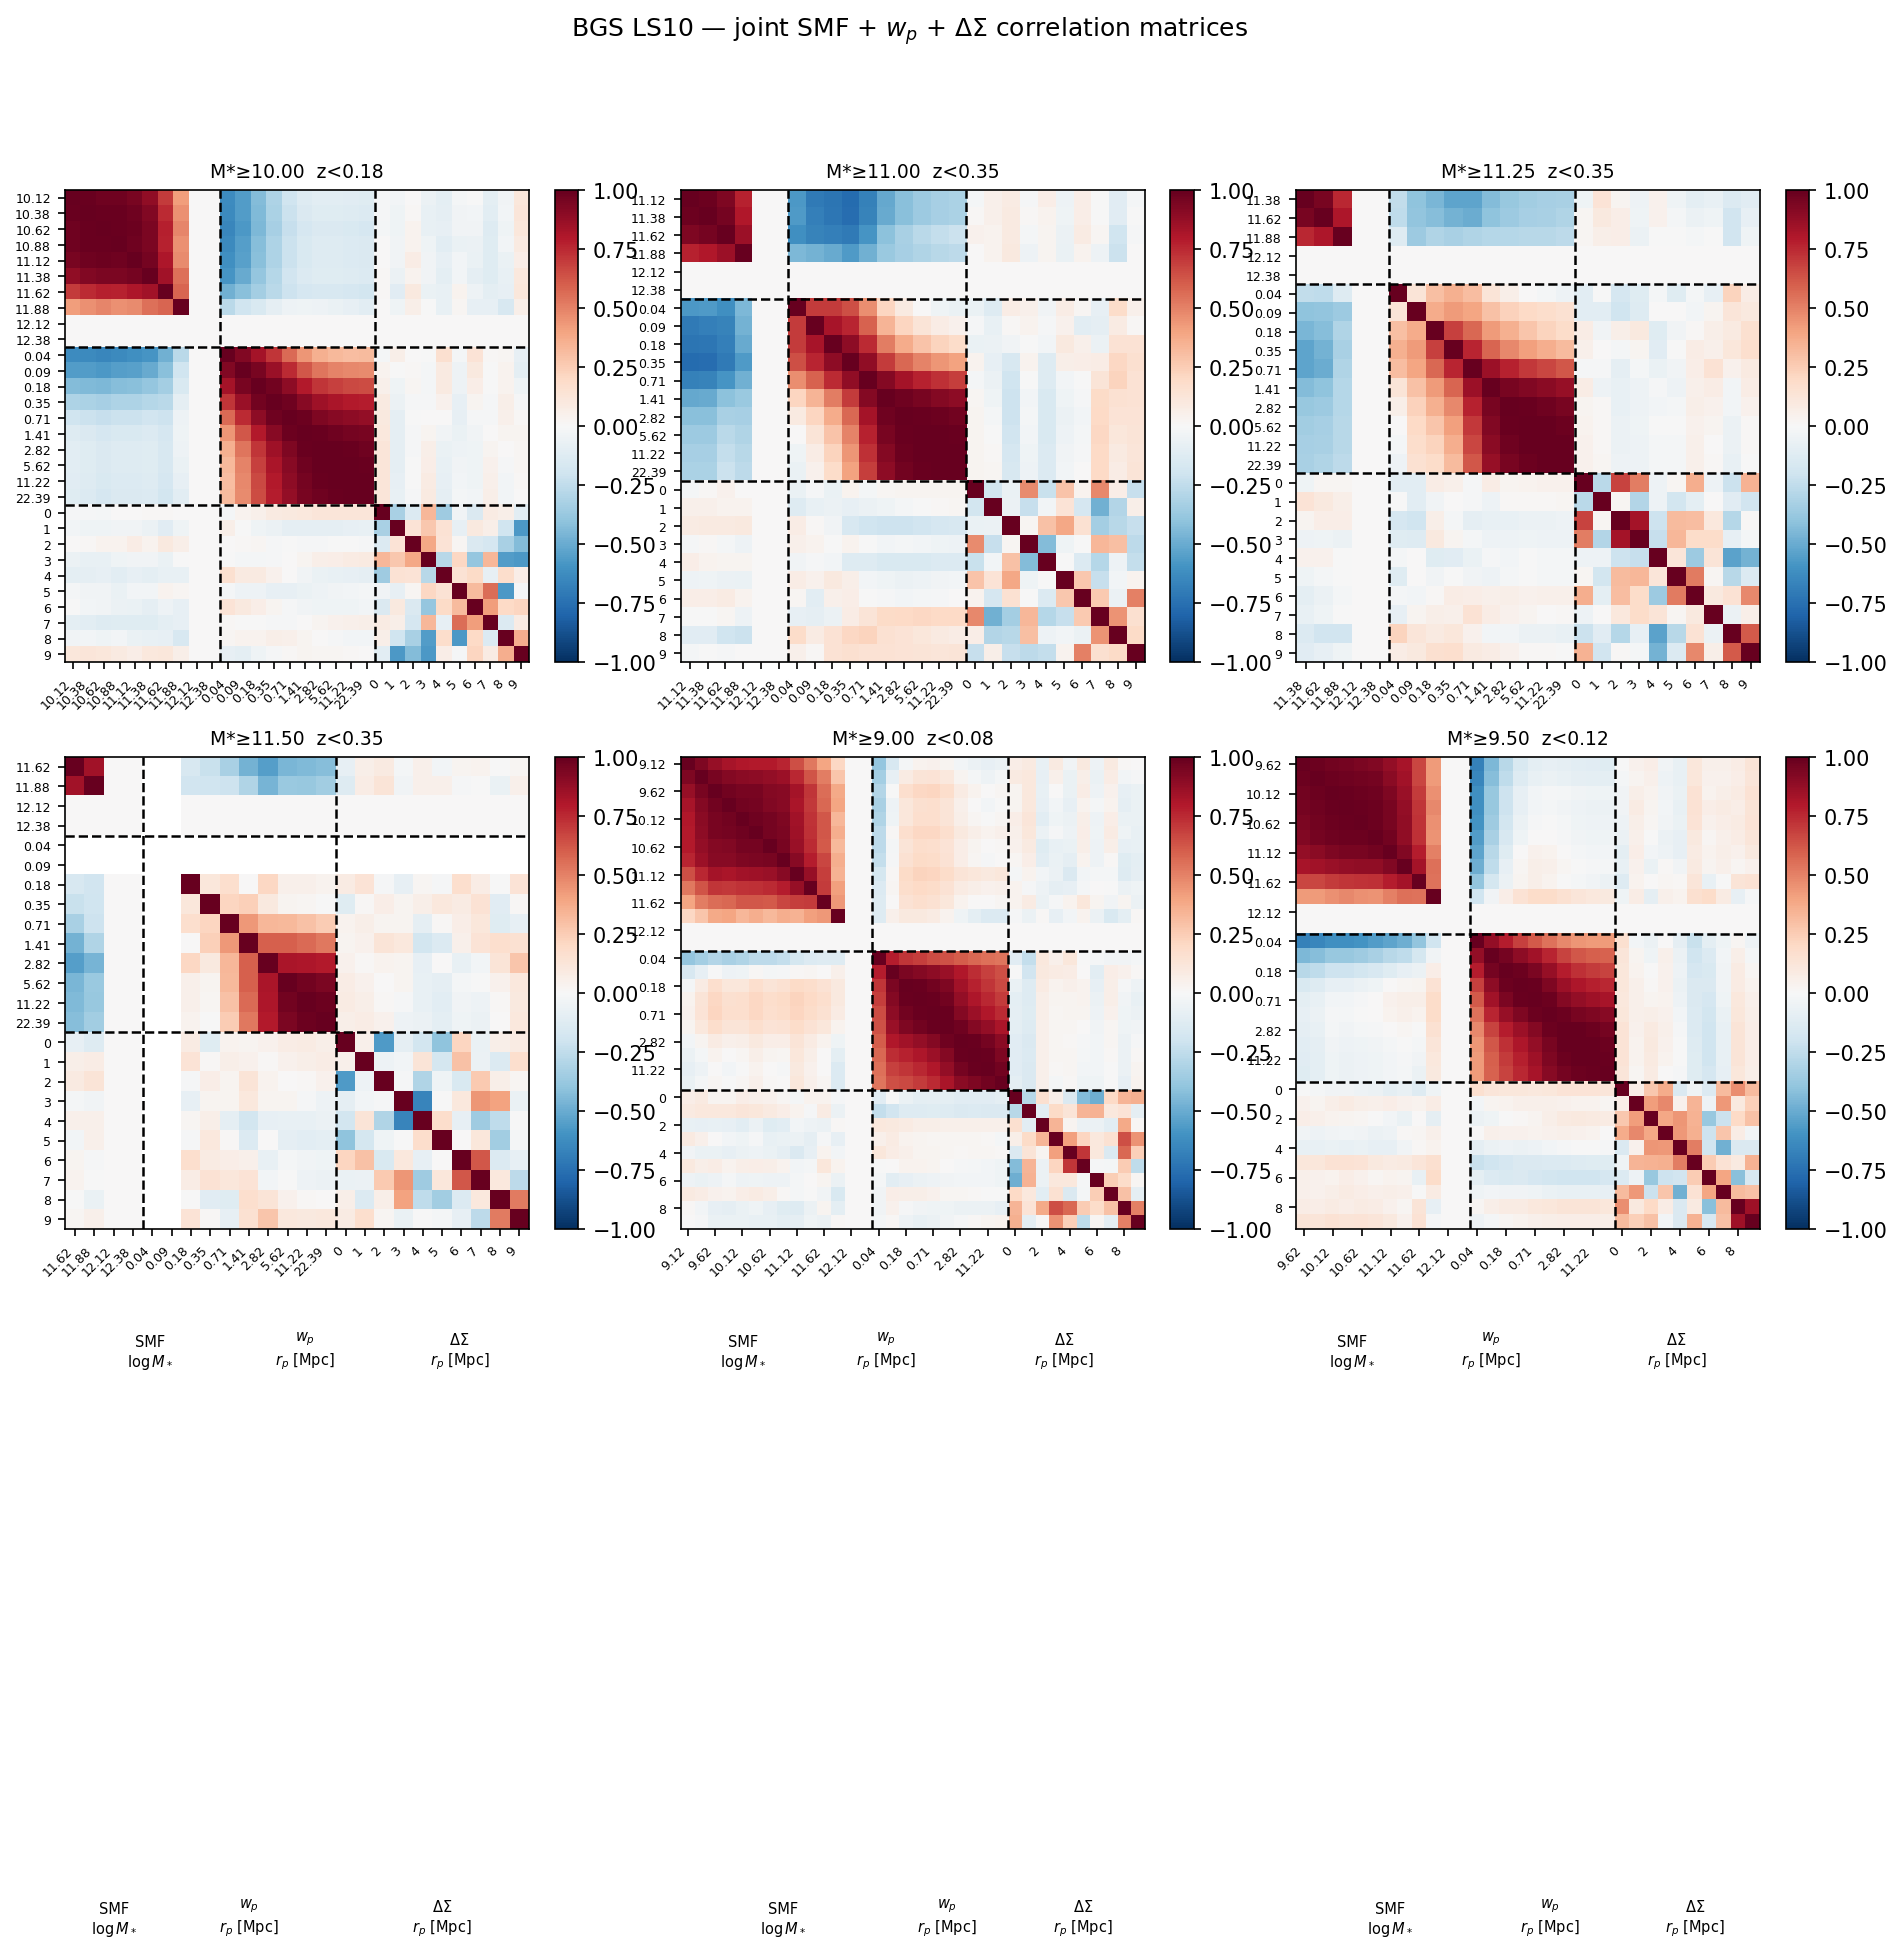
Pearson correlation matrices of the joint SMF + wp + ΔΣ data vector for the six BGS samples that have completed joint covariance files. Dashed lines separate the three statistic blocks.
Comparison with Comparat et al. (2025)
Reference: Comparat et al. (2025), A&A 697, A173, DOI: 10.1051/0004-6361/202554208.
Zenodo data release: https://zenodo.org/records/15111974
Comparat et al. (2025) measure wp(rp) and φ(M★) for seven volume-limited BGS-like samples selected from LS10 using the same stellar-mass thresholds (log₁₀ M★/M☉ > 10.0 … 11.5; zmax = 0.18–0.35). Cosmology: Planck 2018 (H₀ = 67.66, Ωm = 0.30966); survey area: 16 796 deg².
Important
The C2025 FITS files store rp and wp in units of Mpc/h (h = 0.6766). This pipeline uses physical Mpc. All comparisons below convert C2025 values by dividing by h. πmax also differs: C2025 uses πmax = 100 Mpc/h = 147.8 Mpc; this pipeline uses πmax = 100 Mpc.
Quantitative comparison for overlapping samples
SMF — our φ is ~12% lower than C2025, consistent with the larger survey area: φ(ours)/φ(C25) ≈ A(C25)/A(ours) = 16 796/18 950 ≈ 0.886.
log₁₀M★_min |
φ(ours) [Mpc⁻³ dex⁻¹] |
φ(C25, converted) [Mpc⁻³ dex⁻¹] |
Ratio |
|---|---|---|---|
10.0 |
3.91 × 10⁻³ |
4.45 × 10⁻³ |
0.88 |
11.0 |
7.80 × 10⁻⁴ |
8.87 × 10⁻⁴ |
0.88 |
11.25 |
3.06 × 10⁻⁴ |
3.46 × 10⁻⁴ |
0.88 |
11.5 |
7.76 × 10⁻⁵ |
8.71 × 10⁻⁵ |
0.89 |
w:sub:`p` — after unit conversion and interpolation, agreement is ~4–14%; consistent with the different πmax and footprint:
log₁₀M★_min |
wp(0.90 Mpc) ours [Mpc] |
wp(0.90 Mpc) C25 [Mpc] |
Ratio (0.9) |
Ratio (9.1) |
|---|---|---|---|---|
10.0 |
181.6 |
173.9 |
1.04 |
0.98 |
11.0 |
268.1 |
248.7 |
1.08 |
1.02 |
11.25 |
378.6 |
338.1 |
1.12 |
1.06 |
11.5 |
645.6 |
567.6 |
1.14 |
1.07 |
Reference data on disk
$HOME/software/gga_model/data/comparat2025/
└── LSDR10_GALxEVT/
    ├── Measurement_autocorr_galaxies/wprp/
    │   └── LS10_VLIM_ANY_{mmin}_Mstar_12.0_0.05_z_{zmax}_N_{N}-wprp.fits
    │       Columns: rp_min, rp_max, rp_mid [Mpc/h], wprp [Mpc/h],
    │                N_data, N_random, pimax, CV_frac,
    │                wprp_JK_mean, wprp_JK_std [Mpc/h]
    └── Galaxy_samples/smf/
        └── LS10_VLIM_ANY_{mmin}_Mstar_12.0_0.05_z_{zmax}_N_{N}-smf-vmax.fits
            Columns: mstar_min, mstar_max, mstar_mid [dex], phi, phi_err [Mpc⁻³ dex⁻¹], N_gal
Comparison with Xu et al. (2025)
Reference: Xu et al. (2025), arXiv:2503.01948.
Zenodo data release: https://zenodo.org/records/14879599
Xu et al. (2025) measure the GSMF using the PAC (Photometric objects Around Cosmic webs) method, pairing DESI Y1 BGS spectroscopy with a deep DECaLS photometric catalogue (~10 M photometric objects) to recover the GSMF down to ~105.3 M☉. Cosmology: WMAP5 (H₀ = 71, Ωm = 0.268).
Reference data on disk
$HOME/software/gga_model/data/xu2025/
├── SMF_all.fits          PAC total GSMF (all galaxies, Fig. 14)
├── SMF_all_lowlim.fits   PAC lower limits at faint end
├── SMF_blue.fits         PAC star-forming sub-sample
├── SMF_red.fits          PAC quiescent sub-sample
├── BGS.fits              BGS 1/Vmax GSMF (Fig. 15 comparison)
├── BGS_LV_corrected.fits BGS Local Volume completeness-corrected
├── GAMA.fits             GAMA DR4 reference (Driver+2022)
└── PACIII.fits           PAC III variant measurement
All files: columns log10_mstar, phi, phi_err_lo, phi_err_hi
(Mpc-3 dex-1).
Literature entry
The PAC and 1/Vmax results are archived in the standard schema under
literature_measurements/stellar_mass_function/:
literature_measurements/stellar_mass_function/
├── DESI_PAC_Xu2025/
│   ├── metadata.yaml
│   ├── smf_pac_all.fits     (32 rows, 5.3–11.8 dex, incl. lower limits)
│   ├── smf_pac_blue.fits    (41 rows)
│   └── smf_pac_red.fits     (32 rows)
└── DESI_Vmax_Xu2025/
    ├── metadata.yaml
    ├── smf_vmax_all.fits    (59 rows, 6.0–11.9 dex, 0.1 dex bins)
    └── smf_vmax_lv_corrected.fits  (9 rows, Local Volume correction)
Regenerating figures
After new results are available, re-run:
python docs/scripts/make_run_figures.py
cd docs && make html