Uchuu Mock VLIM M★ — Run Summary
Uchuu N-body mock catalogues are matched to the BGS VLIM M★ samples
by density, redshift range, and stellar-mass threshold.
The summary statistics are computed with measure_MOCK_VLIM_Mstar.ipynb.
Cosmology: Planck18 (H₀ = 67.4, Ω_m = 0.315)
Survey footprint: 1/8 sky, RA ∈ [180°, 270°], Dec ∈ [−90°, 0°], area = 5 156.6 deg².
Redshift column: redshift_S (spectroscopic-like).
Stellar mass column: log₁₀(obs_sm) (SHAM-assigned masses).
Weights: uniform (no systematic correction).
Note
All samples use 100 jackknife regions (N_JK=100).
Random catalogues are subsampled to 5 × N_gal before pair counting
to keep corrfunc tree overhead manageable for small-volume samples.
Sample inventory
Sample key |
N_gal |
z_min |
z_max |
log₁₀M★_min |
N_JK |
|---|---|---|---|---|---|
MOCK_VLIM_ANY_Mstar9.29_z0.05-0.08 |
155 846 |
0.05 |
0.08 |
9.29 |
100 |
MOCK_VLIM_ANY_Mstar9.78_z0.05-0.12 |
408 958 |
0.05 |
0.12 |
9.78 |
100 |
MOCK_VLIM_ANY_Mstar10.24_z0.05-0.18 |
781 950 |
0.05 |
0.18 |
10.24 |
100 |
MOCK_VLIM_ANY_Mstar10.45_z0.05-0.22 |
936 461 |
0.05 |
0.22 |
10.45 |
100 |
MOCK_VLIM_ANY_Mstar10.65_z0.05-0.26 |
923 373 |
0.05 |
0.26 |
10.65 |
100 |
MOCK_VLIM_ANY_Mstar10.84_z0.05-0.31 |
793 669 |
0.05 |
0.31 |
10.84 |
100 |
MOCK_VLIM_ANY_Mstar11.03_z0.05-0.35 |
460 808 |
0.05 |
0.35 |
11.03 |
100 |
MOCK_VLIM_ANY_Mstar11.22_z0.05-0.35 |
157 946 |
0.05 |
0.35 |
11.22 |
100 |
MOCK_VLIM_ANY_Mstar11.39_z0.05-0.35 |
50 067 |
0.05 |
0.35 |
11.39 |
100 |
Output files
data/mocks/
├── twopcf/{key}-wtheta.h5          w(θ)   — Landy–Szalay, TreeCorr variance
├── twopcf/{key}-wp-pimax100.h5     wp(rp) — Landy–Szalay, TreeCorr variance
├── lf_smf/{key}-smf-vmax.h5        SMF    — 1/Vmax, jackknife covariance
└── joint/{key}-joint_smf_wp.h5     Joint SMF + wp, full jackknife covariance
Sample characterisation
Figures below are produced by make_mocks and show the match between
the BGS observation (blue) and the Uchuu mock (orange). All 9 samples
are now characterised.
M★ ≥ 9.29 (N = 155 846, z < 0.08)
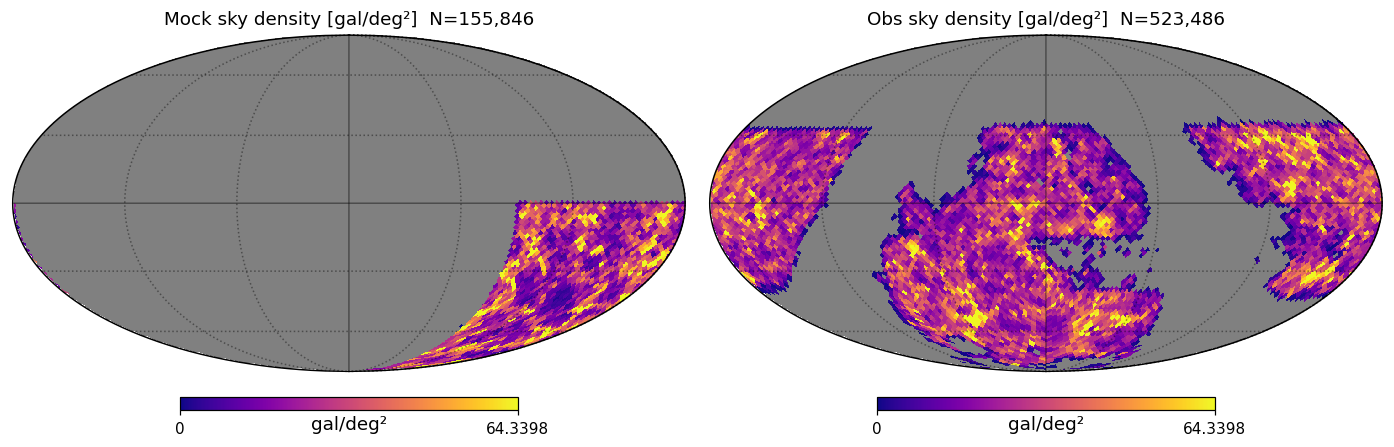
Sky footprint (RA/Dec) of the M★≥9.29 mock.
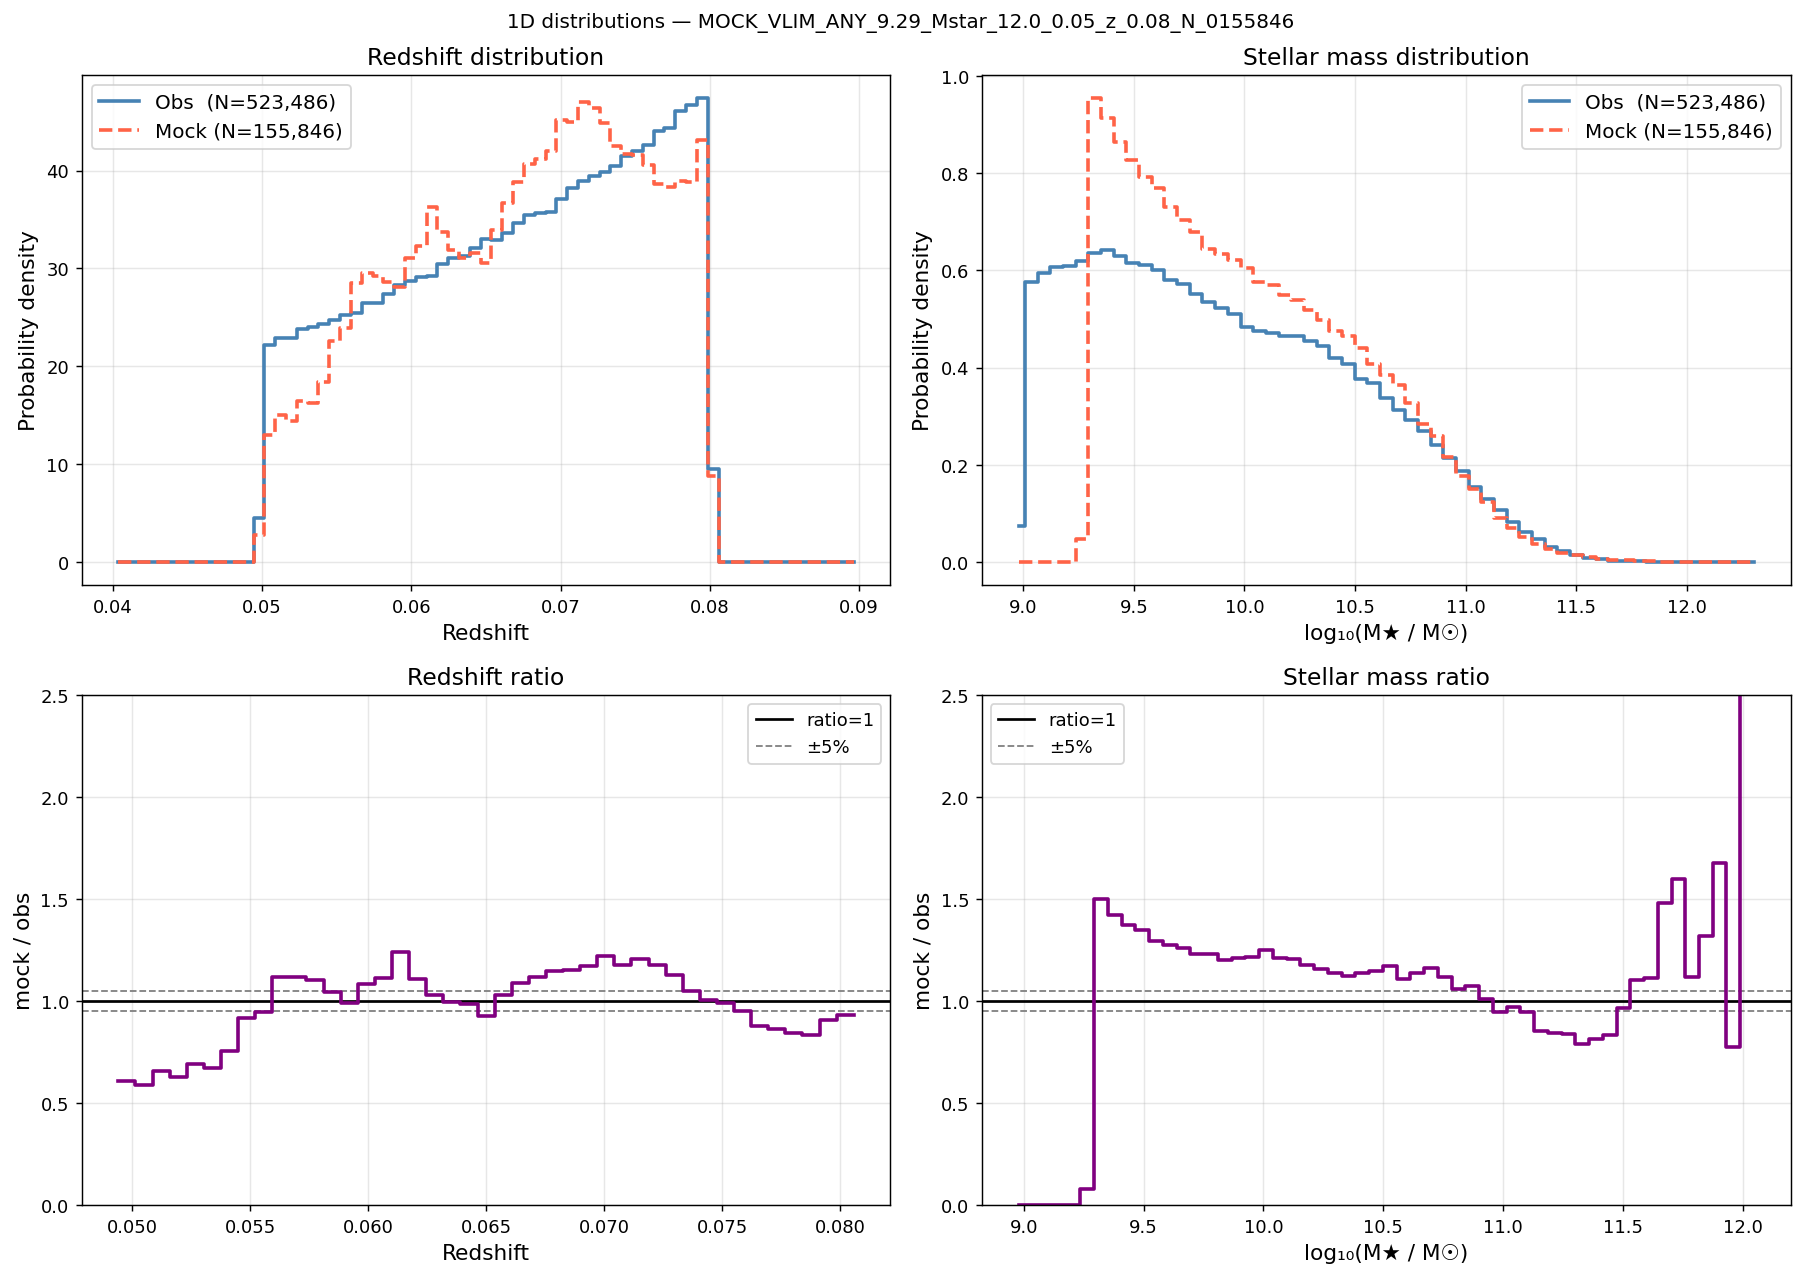
Redshift (left) and stellar-mass (right) distributions for the M★≥9.29 mock.
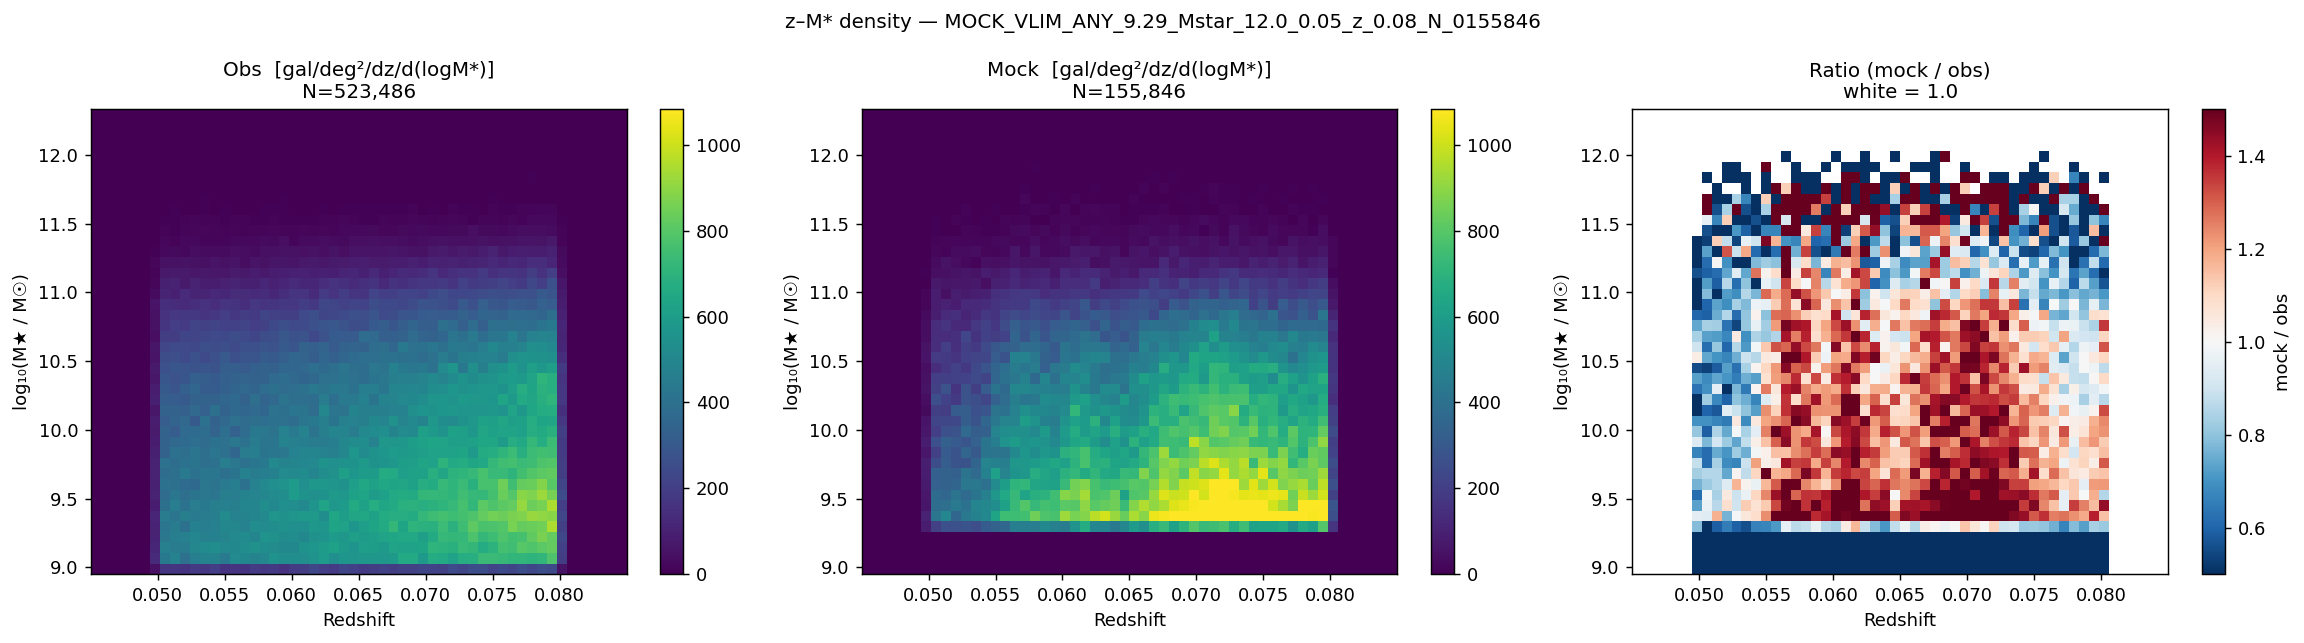
Stellar-mass vs. redshift plane for the M★≥9.29 mock and the corresponding BGS sample.
M★ ≥ 9.78 (N = 408 958, z < 0.12)
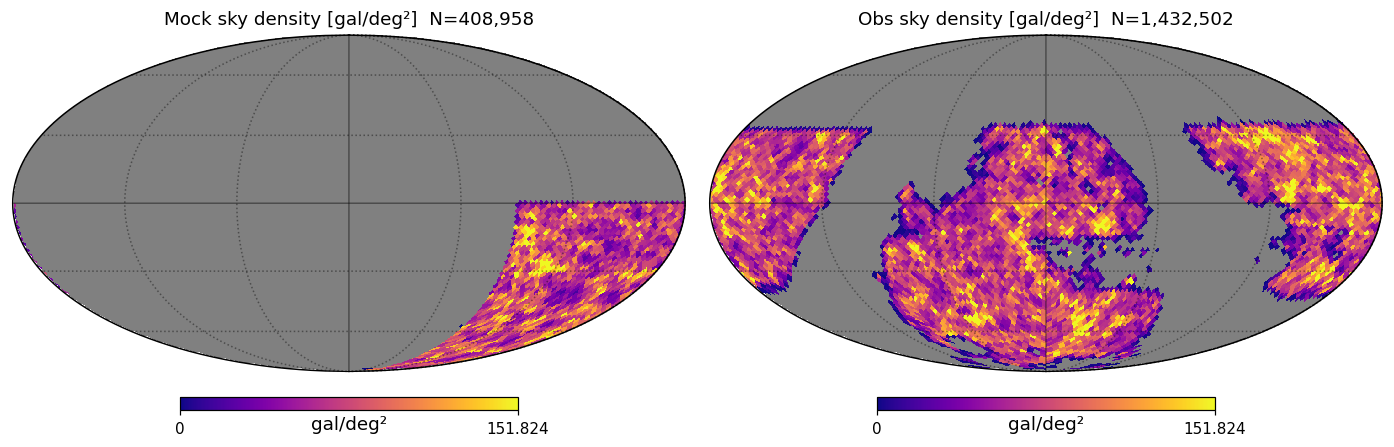
Sky footprint (RA/Dec) of the M★≥9.78 mock.
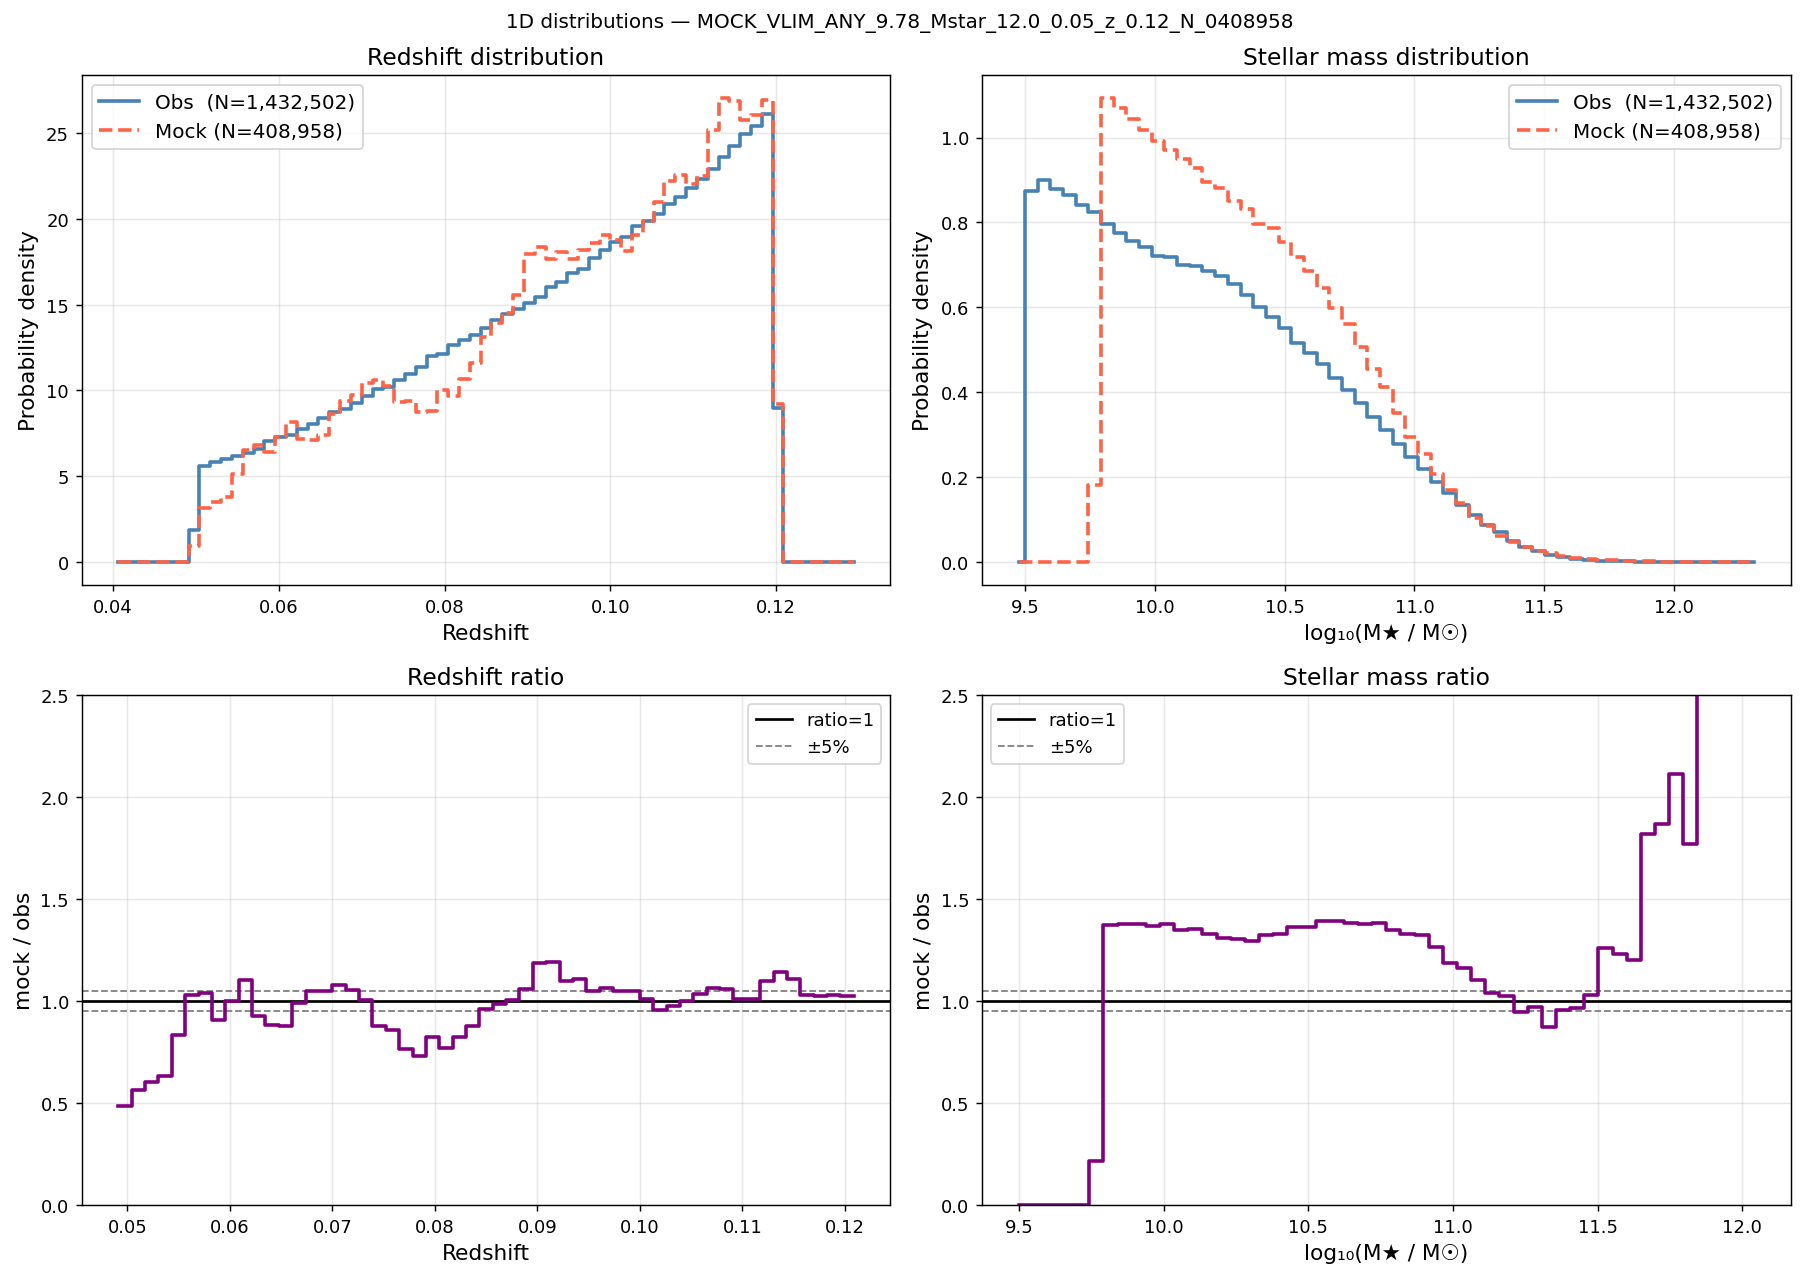
Redshift (left) and stellar-mass (right) distributions for the M★≥9.78 mock.
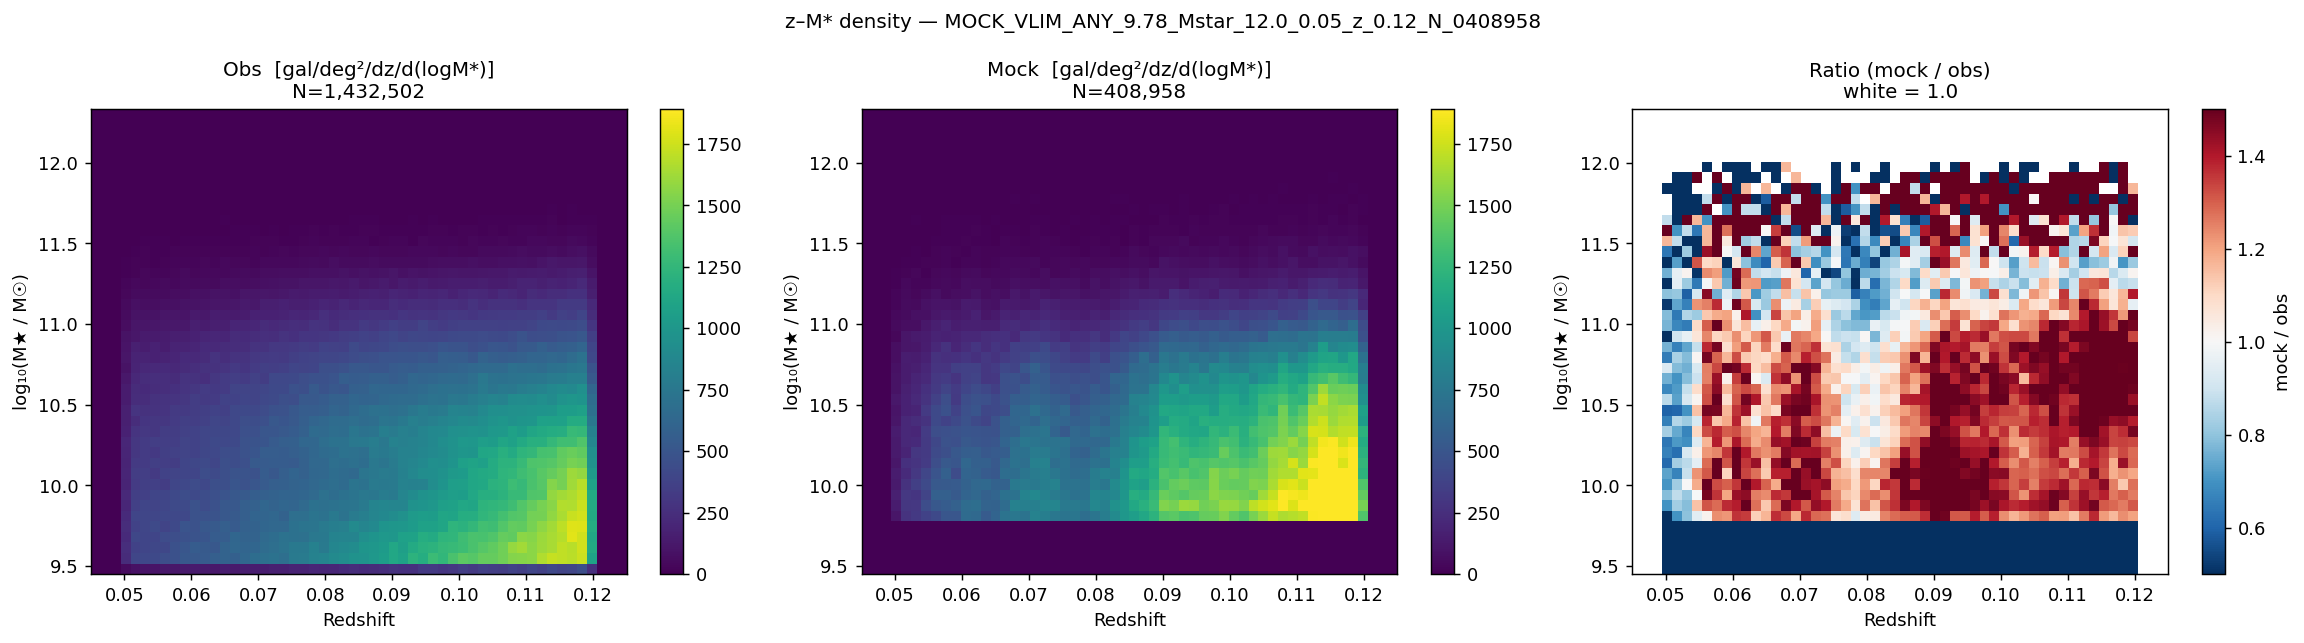
Stellar-mass vs. redshift plane for the M★≥9.78 mock and the corresponding BGS sample.
M★ ≥ 10.24 (N = 781 950, z < 0.18)
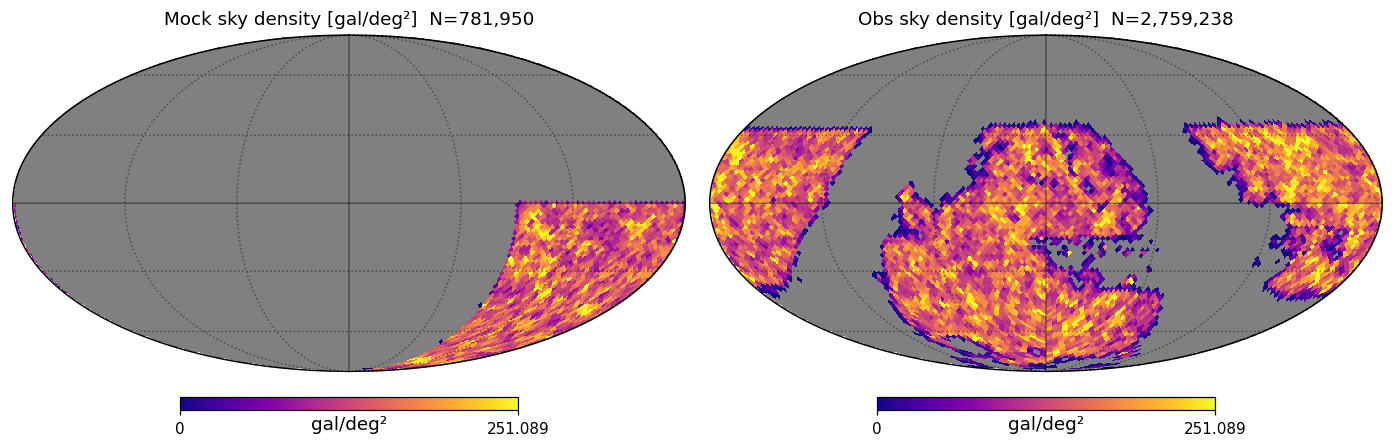
Sky footprint (RA/Dec) of the M★≥10.24 mock. The mock covers the southern Galactic octant (RA ∈ [180°, 270°], Dec < 0°).
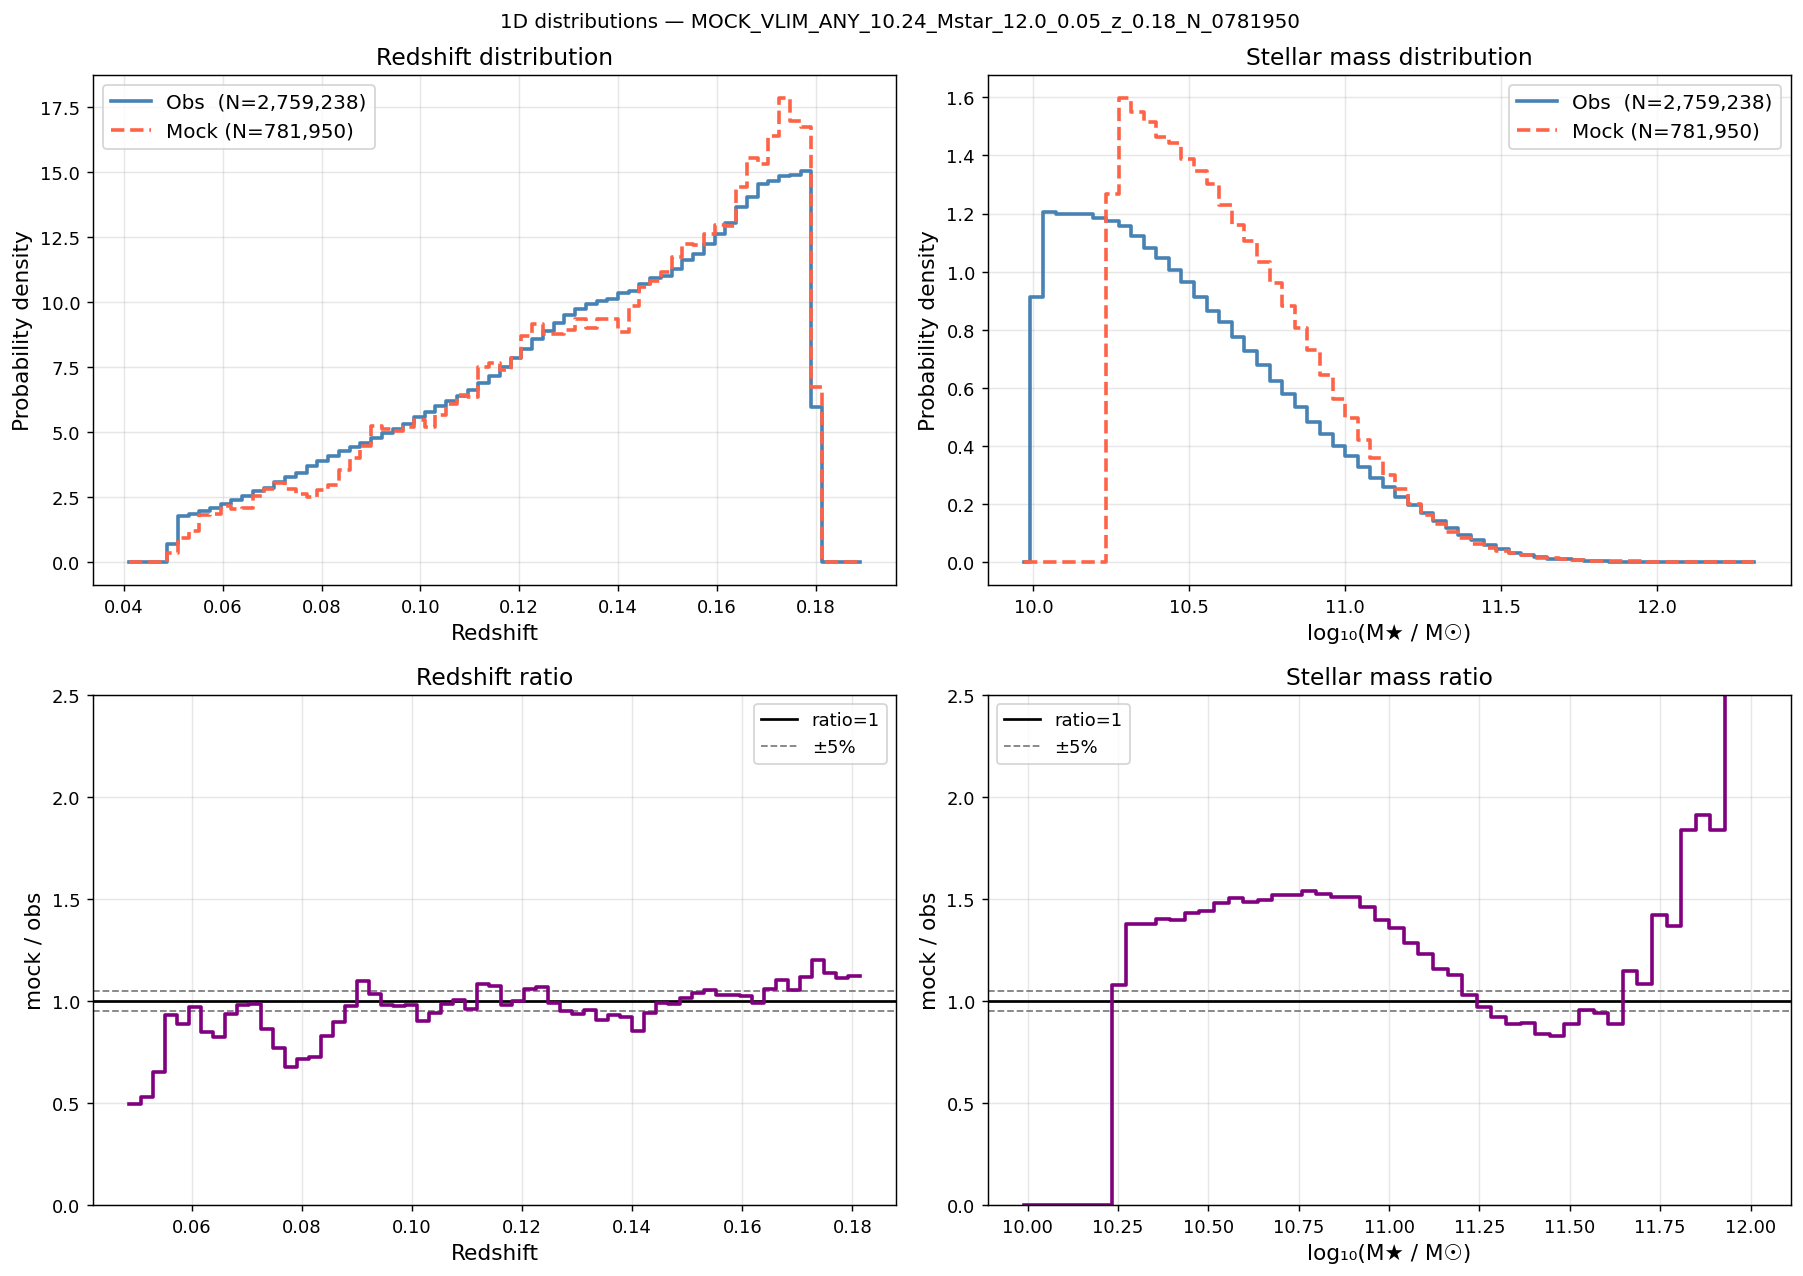
Redshift (left) and stellar-mass (right) distributions for the M★≥10.24 mock. Density is matched to within 0.001% of the observed value.
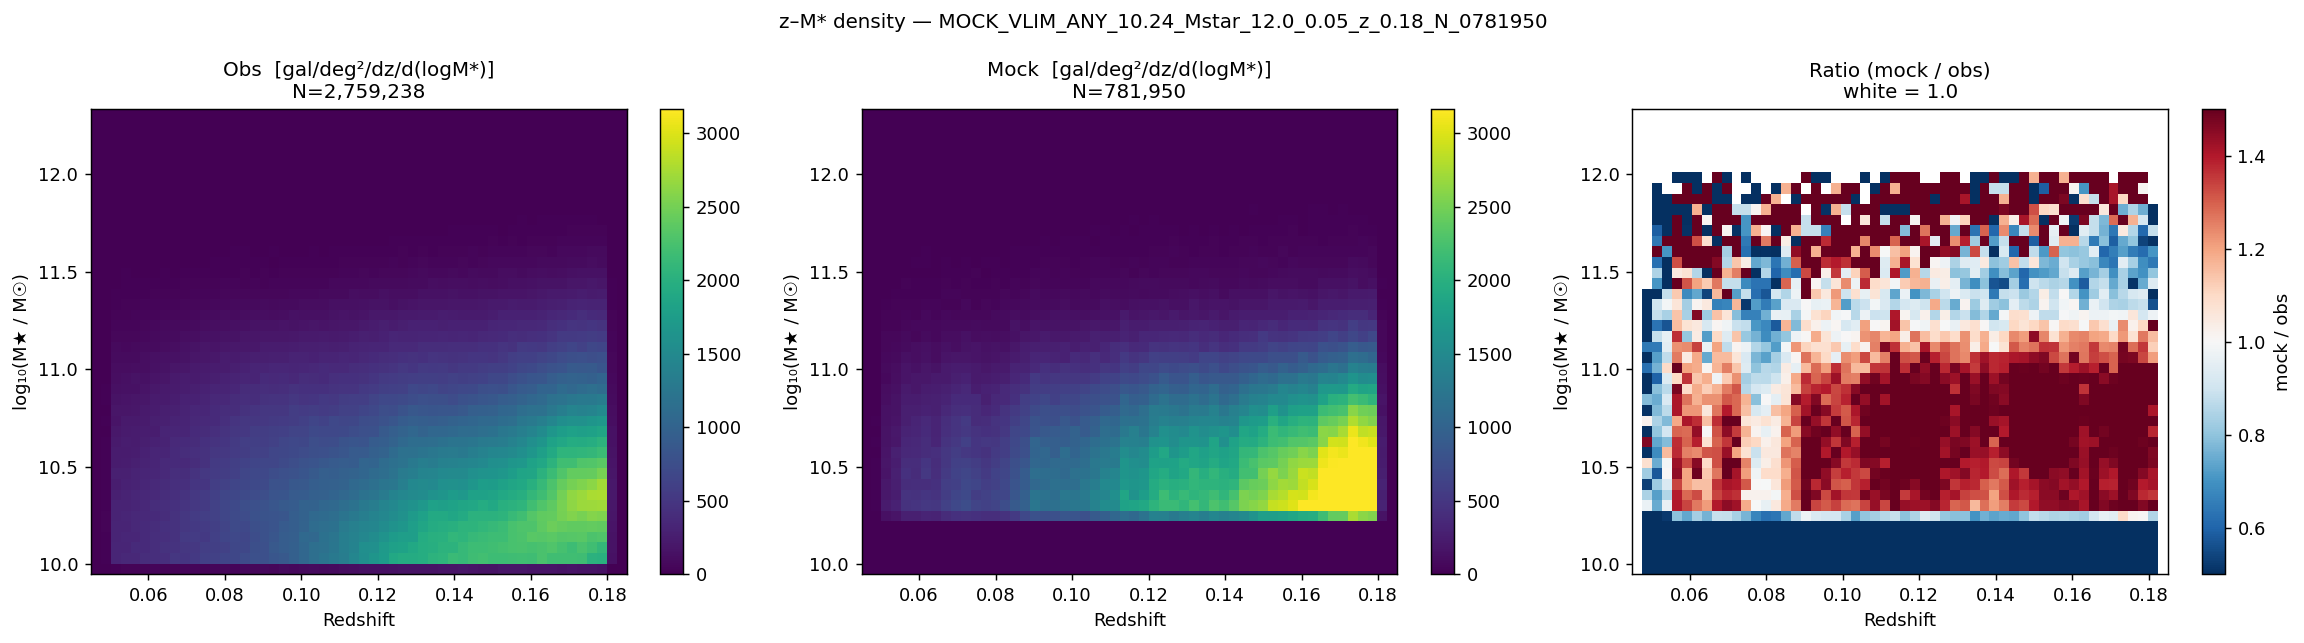
Stellar-mass vs. redshift plane for the M★≥10.24 mock and the corresponding BGS sample.
M★ ≥ 10.45 (N = 936 461, z < 0.22)
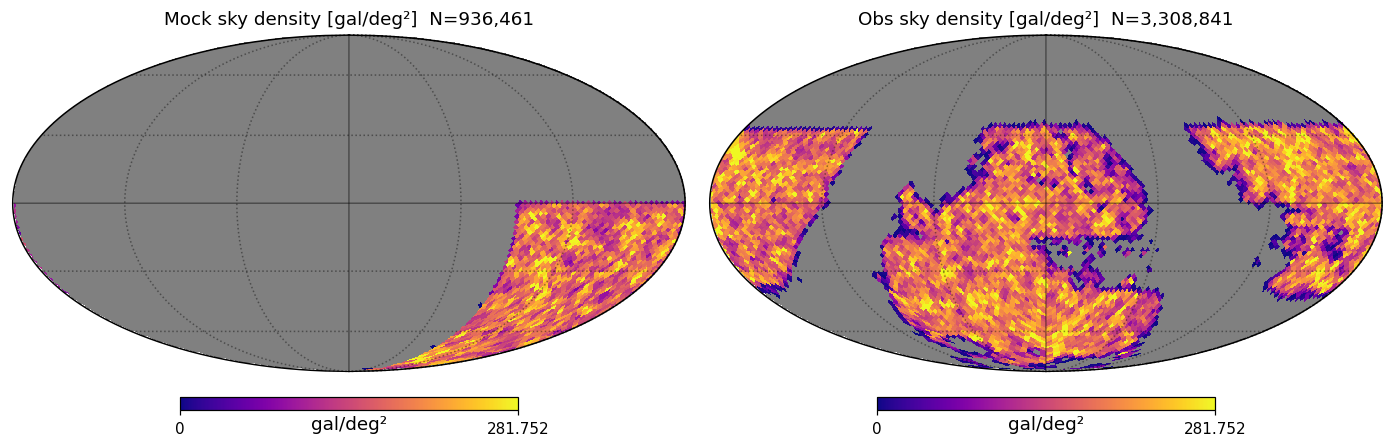
Sky footprint (RA/Dec) of the M★≥10.45 mock.
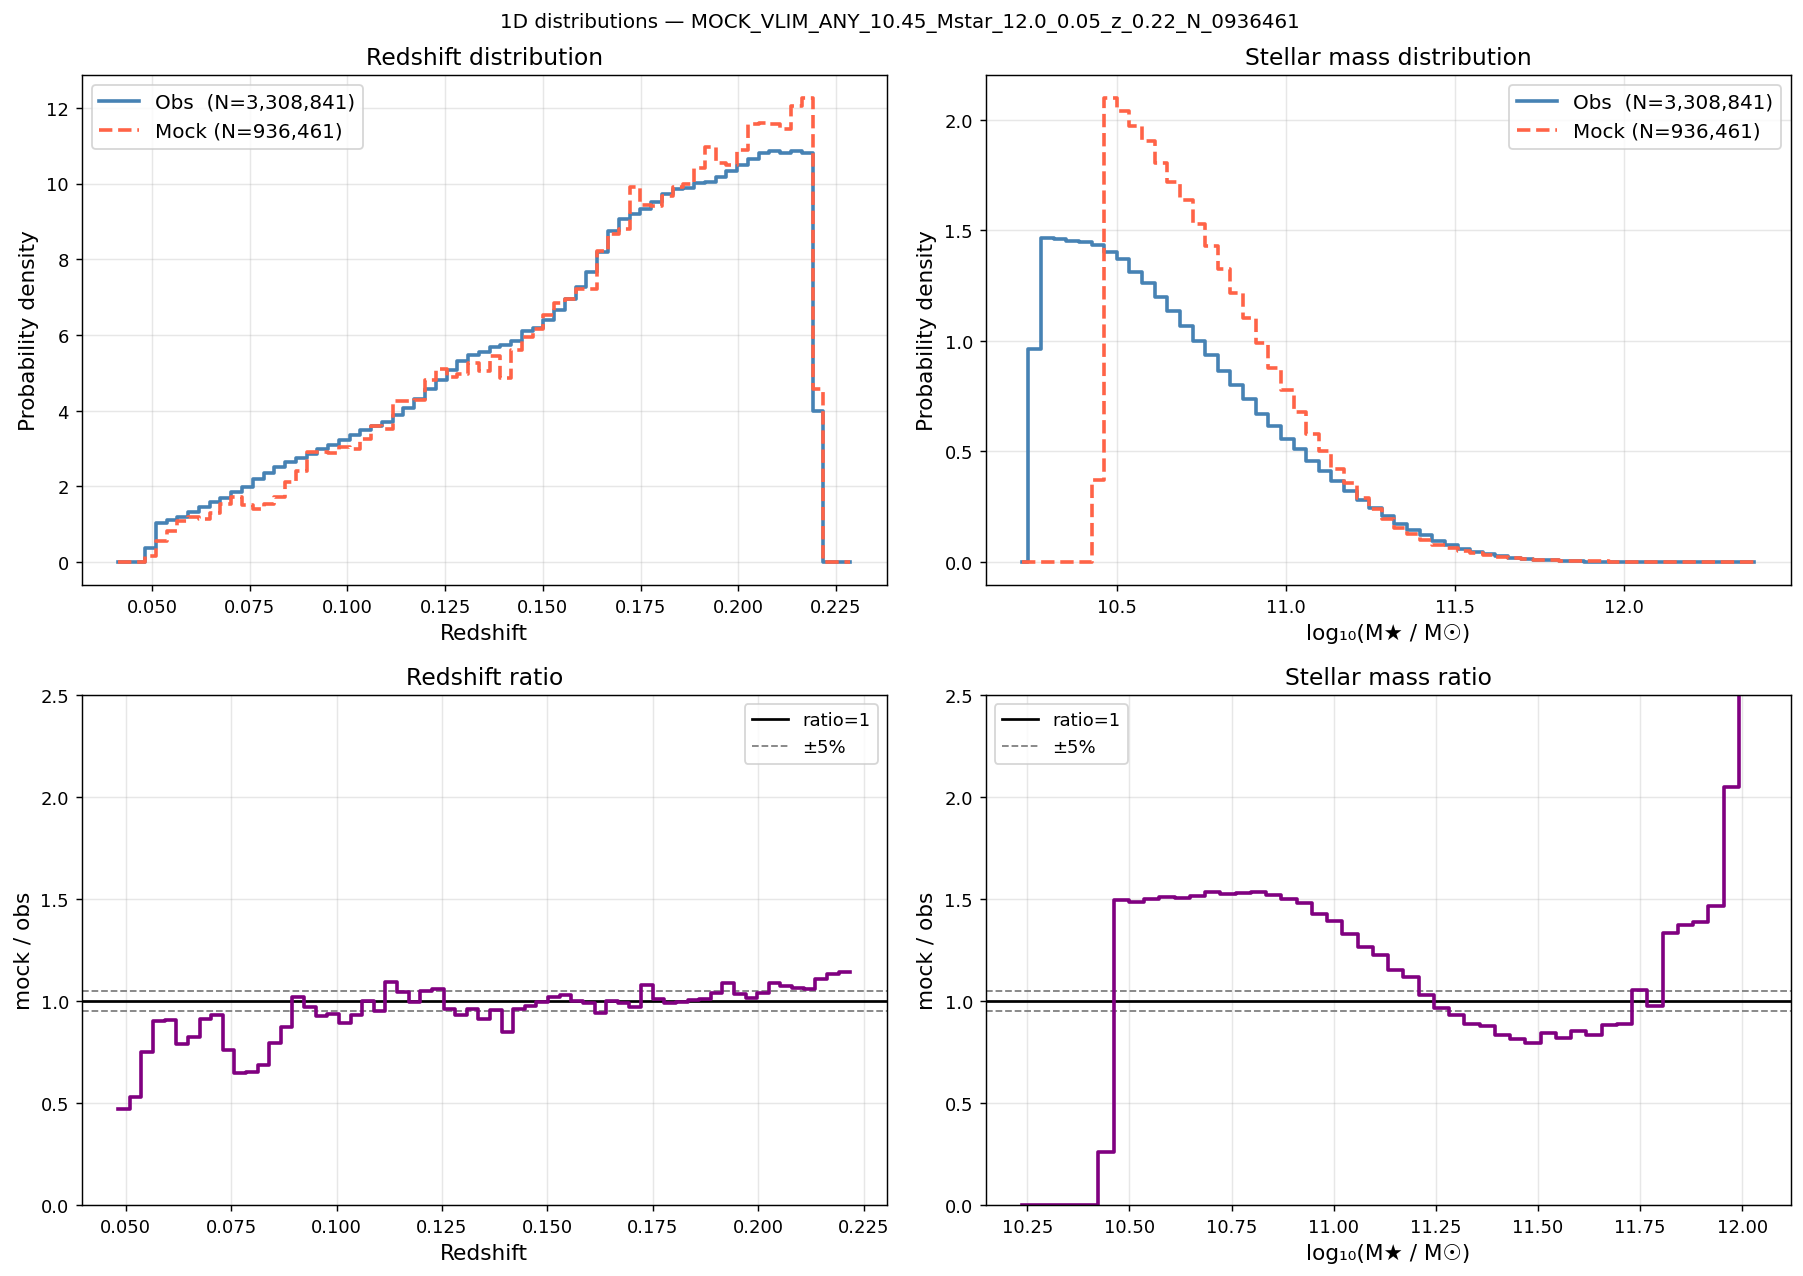
Redshift (left) and stellar-mass (right) distributions for the M★≥10.45 mock.
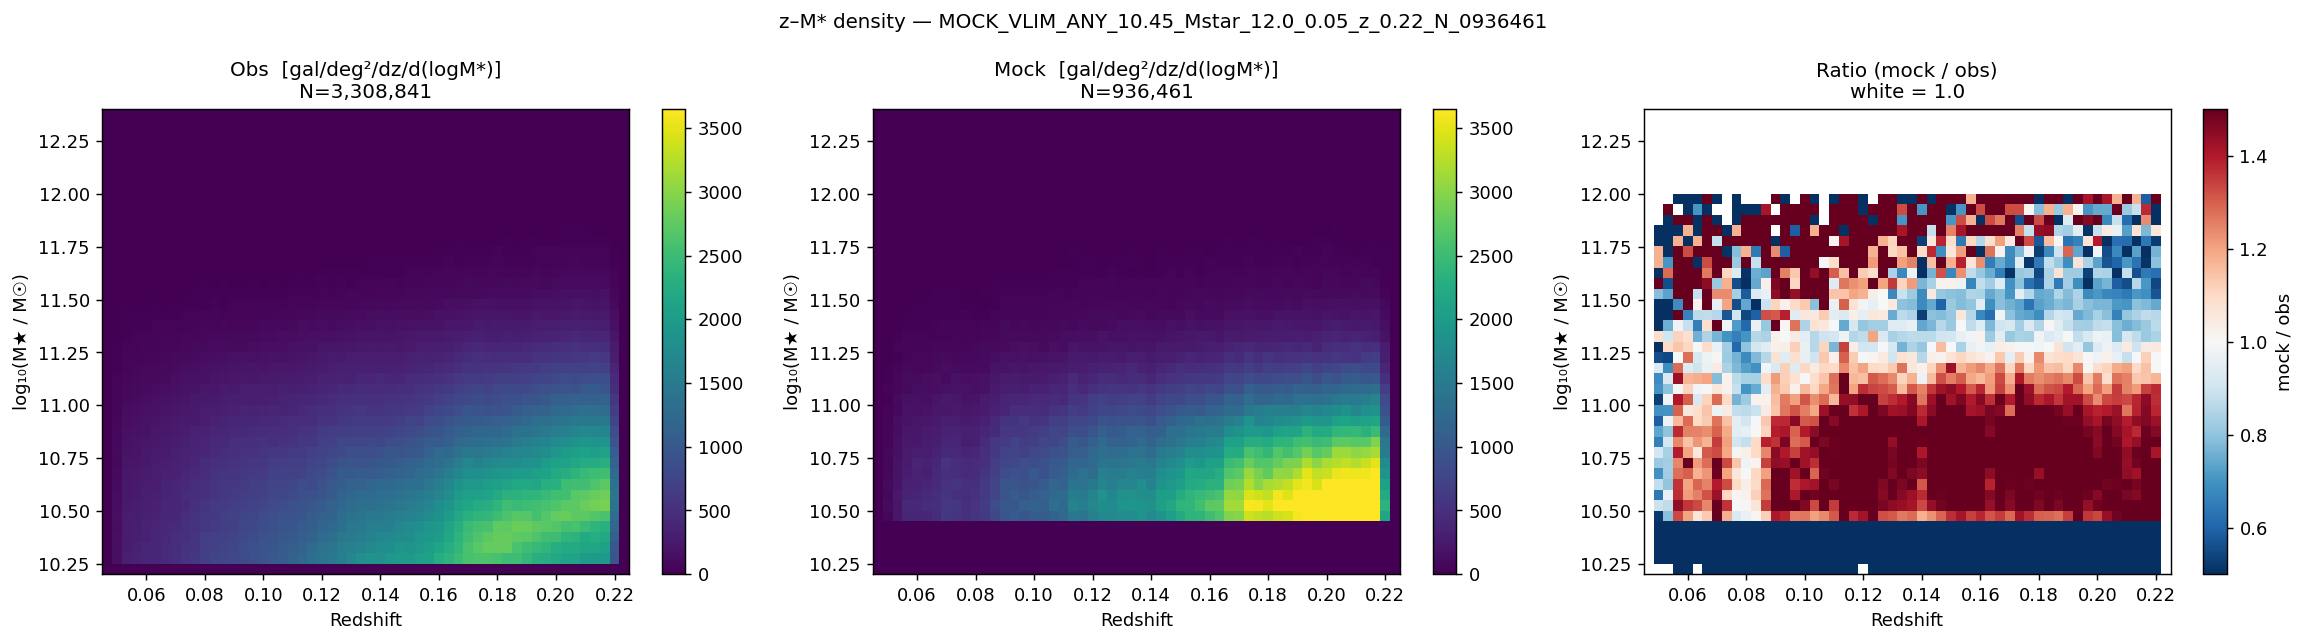
Stellar-mass vs. redshift plane for the M★≥10.45 mock and the corresponding BGS sample.
M★ ≥ 10.65 (N = 923 373, z < 0.26)

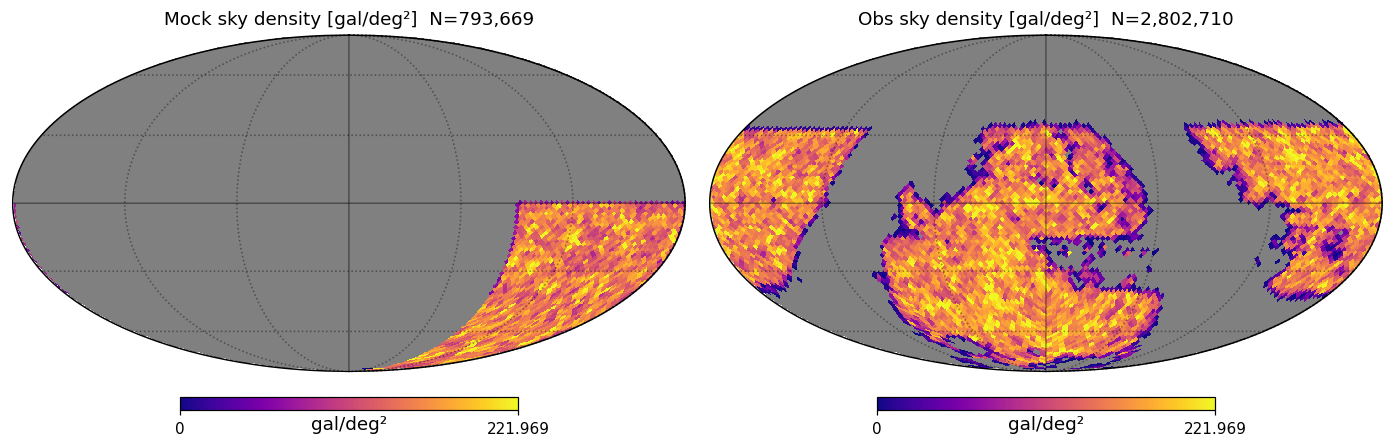
Sky footprint (RA/Dec) of the M★≥10.65 mock.
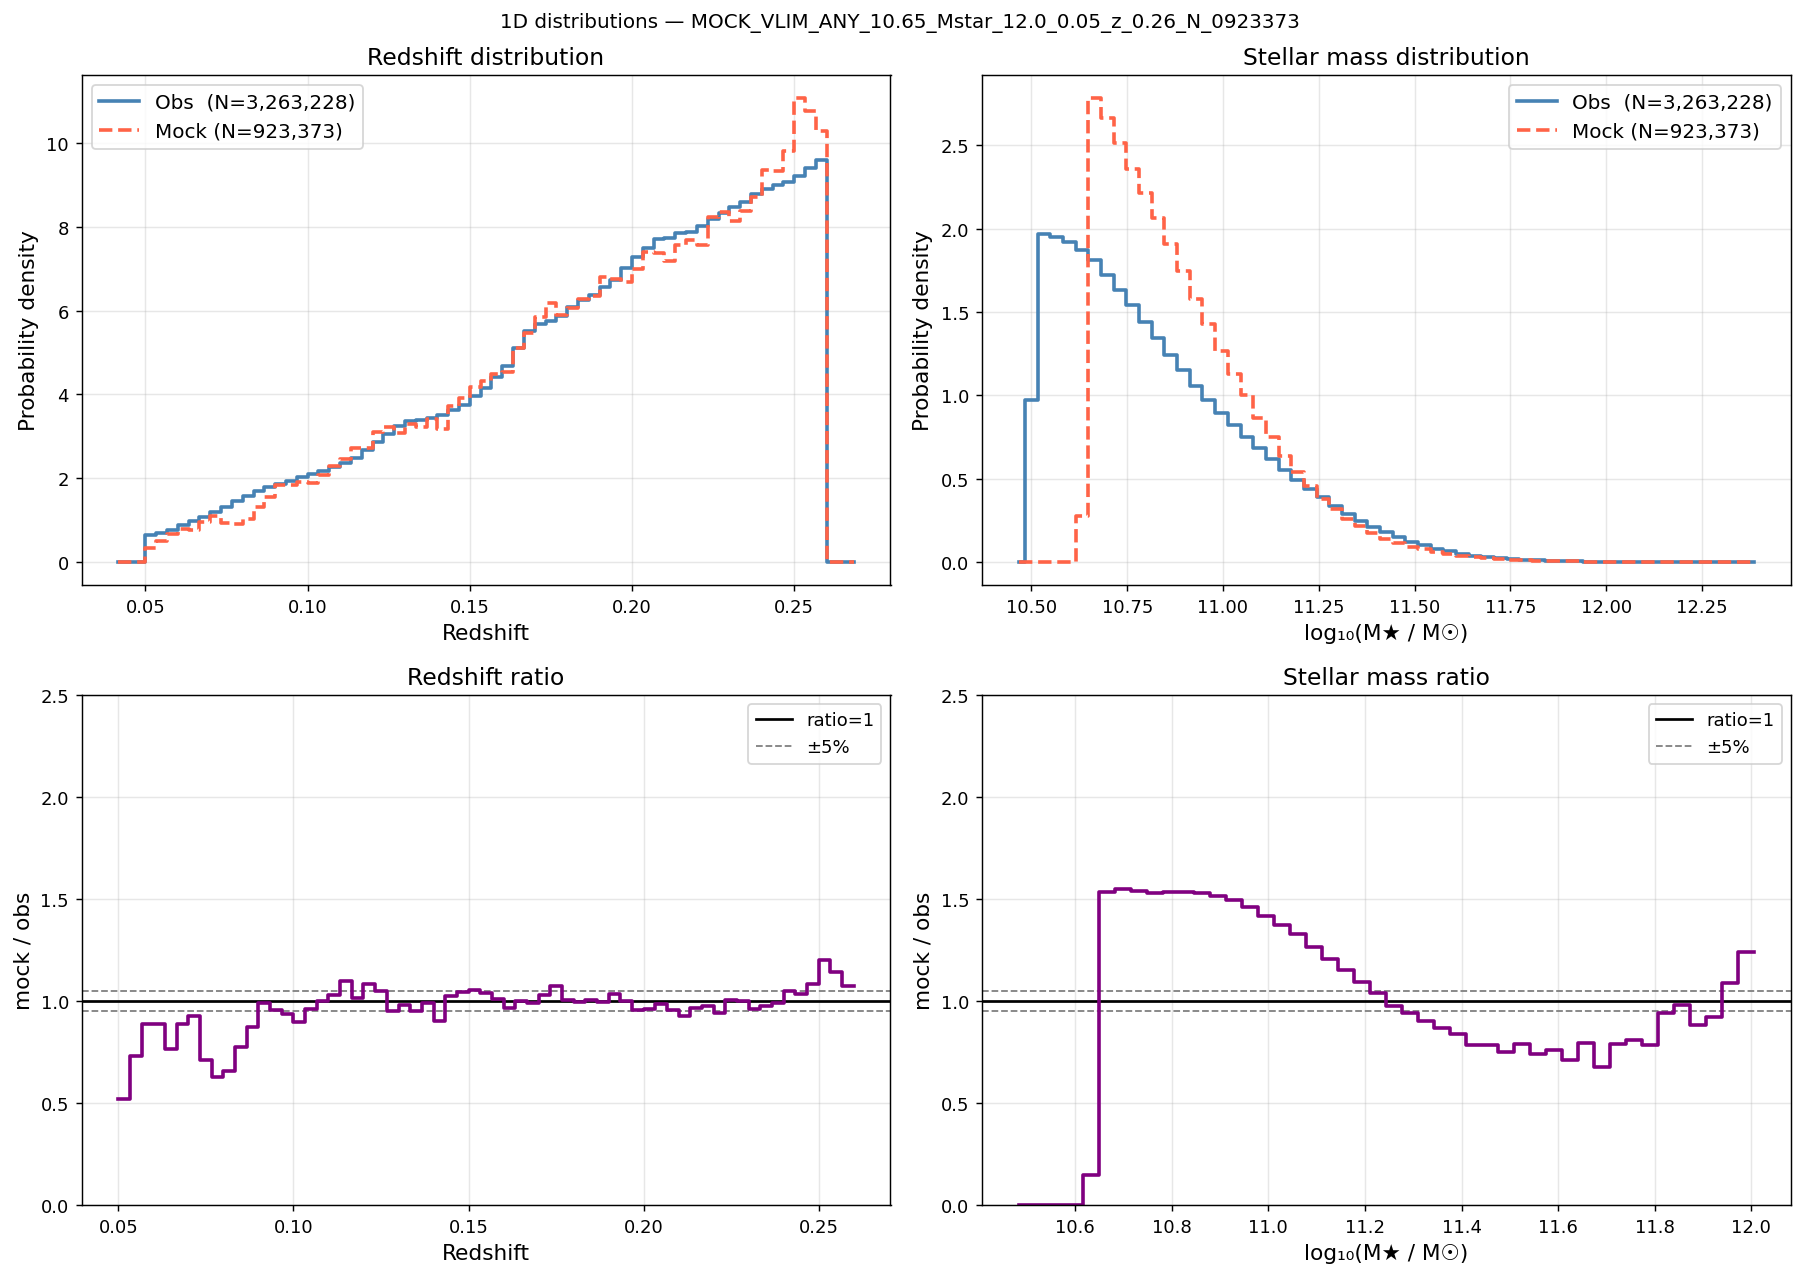
Redshift (left) and stellar-mass (right) distributions for the M★≥10.65 mock.
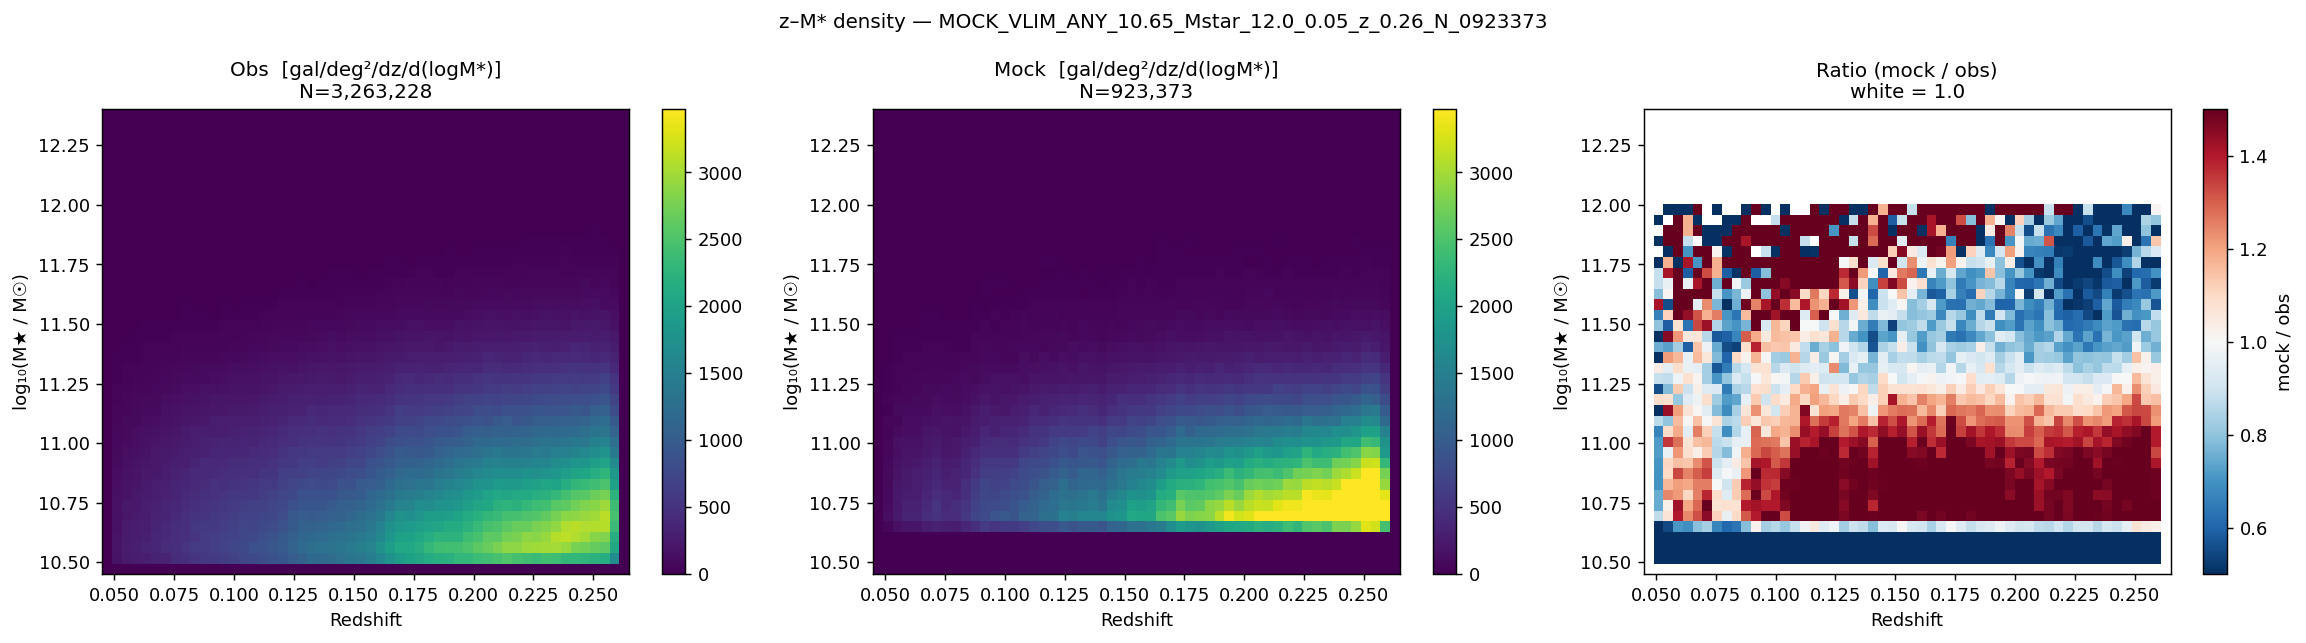
Stellar-mass vs. redshift plane for the M★≥10.65 mock and the corresponding BGS sample.
M★ ≥ 10.84 (N = 793 669, z < 0.31)
Sky footprint (RA/Dec) of the M★≥10.84 mock.
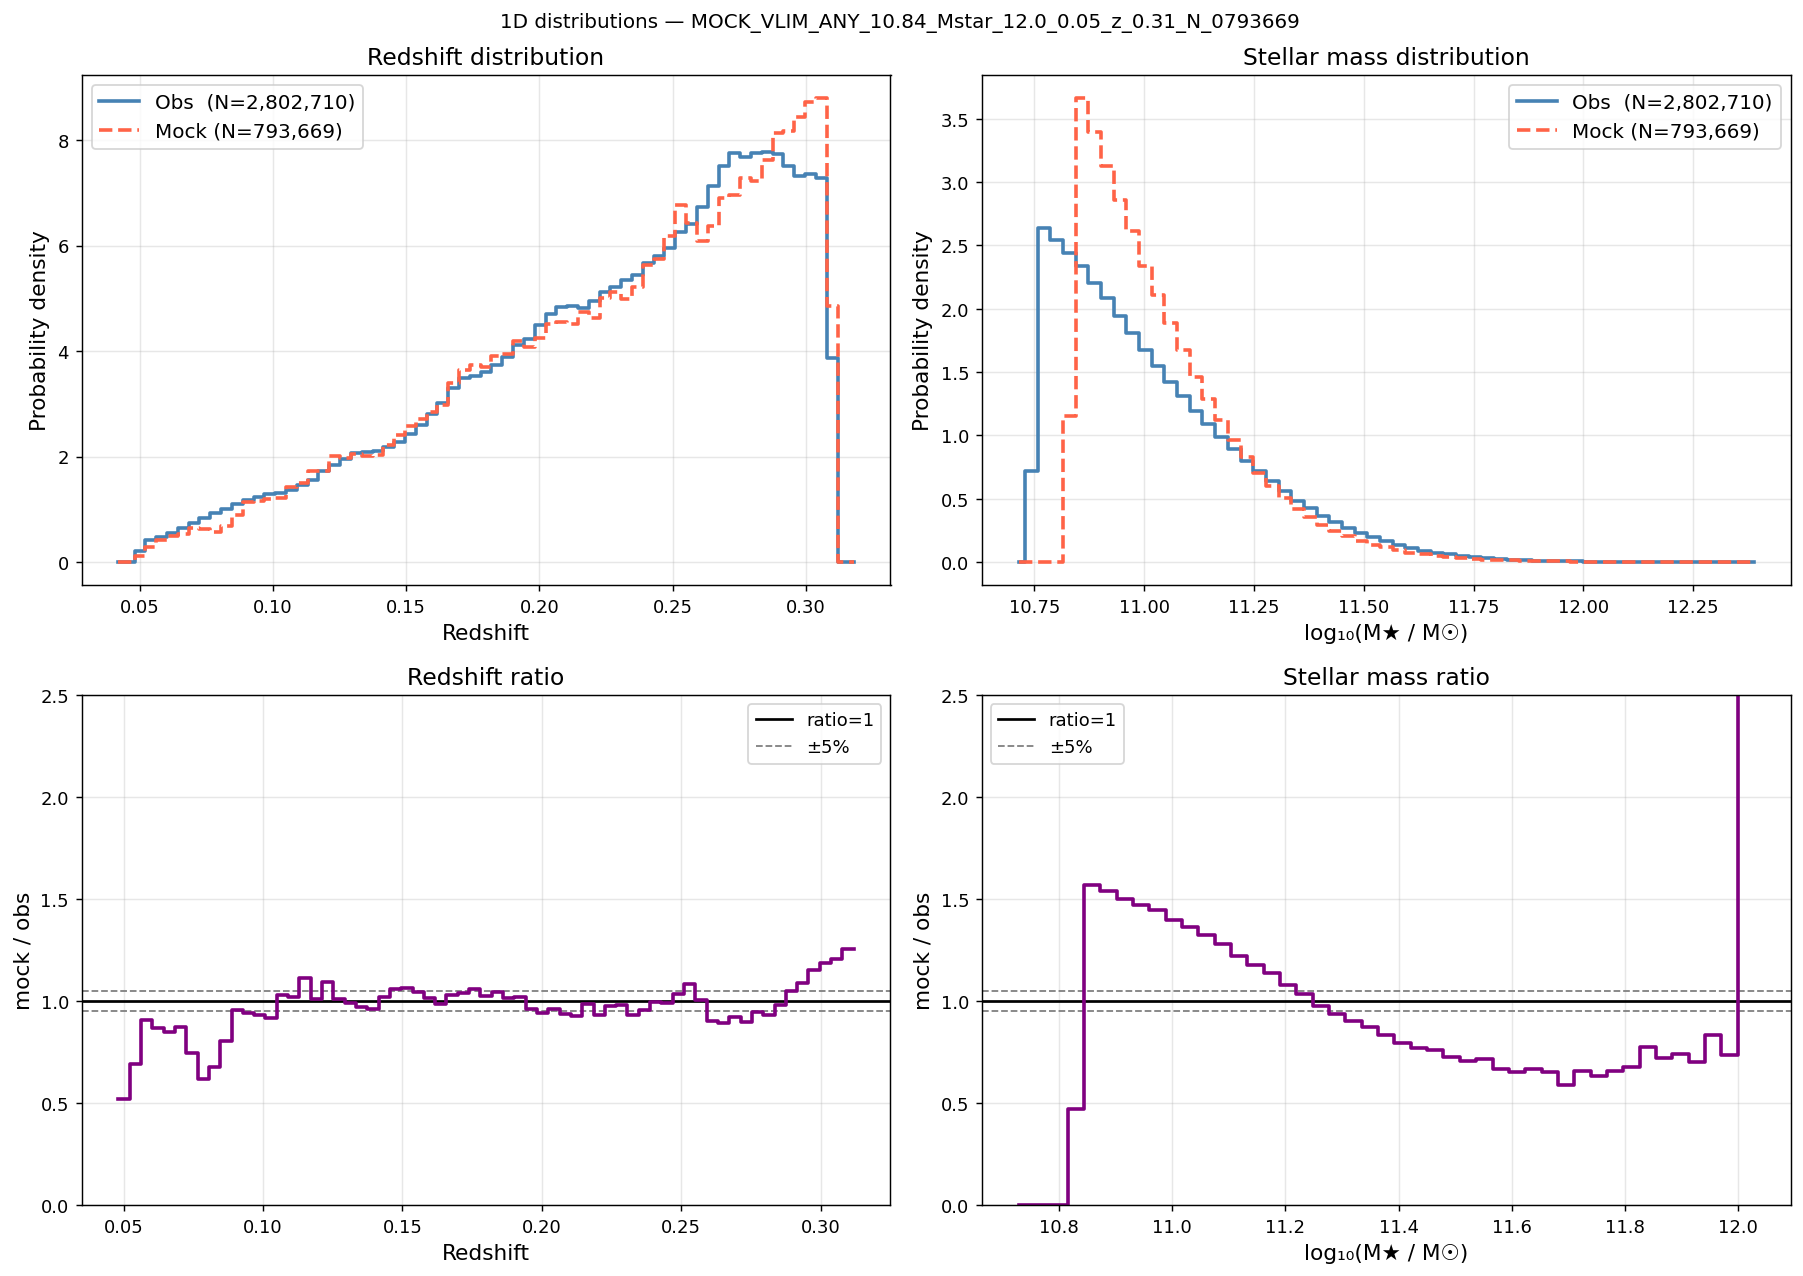
Redshift (left) and stellar-mass (right) distributions for the M★≥10.84 mock.
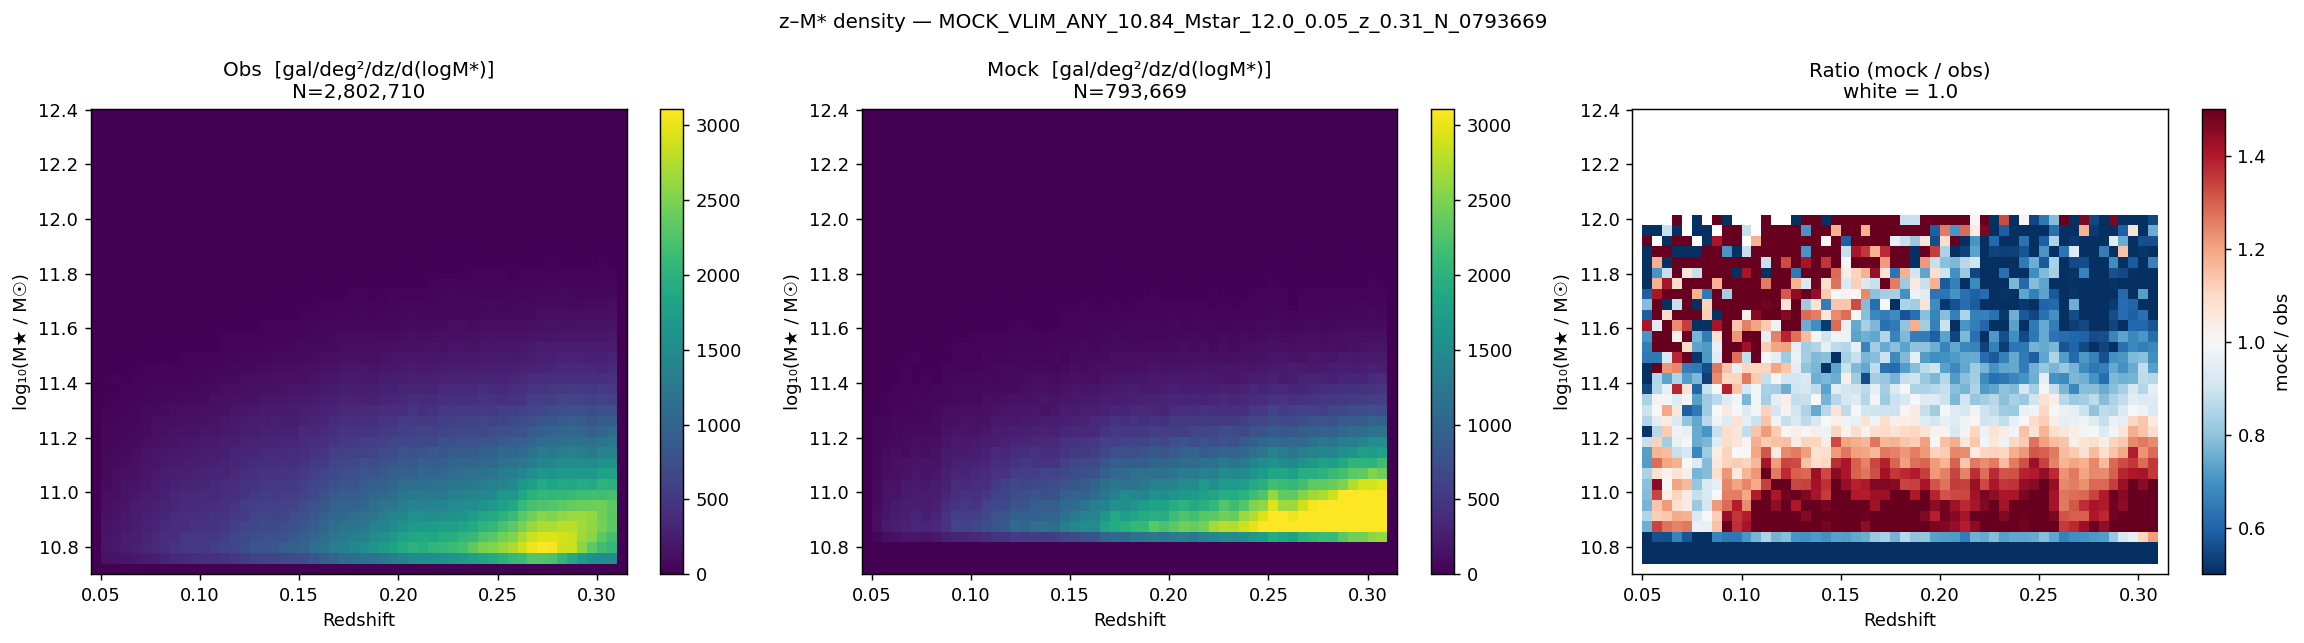
Stellar-mass vs. redshift plane for the M★≥10.84 mock and the corresponding BGS sample.
M★ ≥ 11.03 (N = 460 808, z < 0.35)
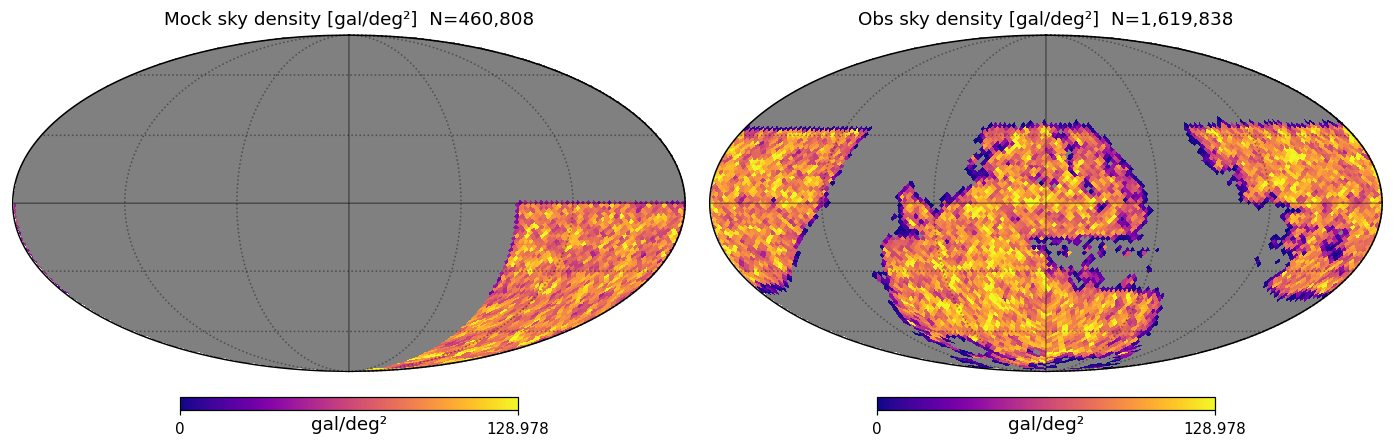
Sky footprint (RA/Dec) of the M★≥11.03 mock.
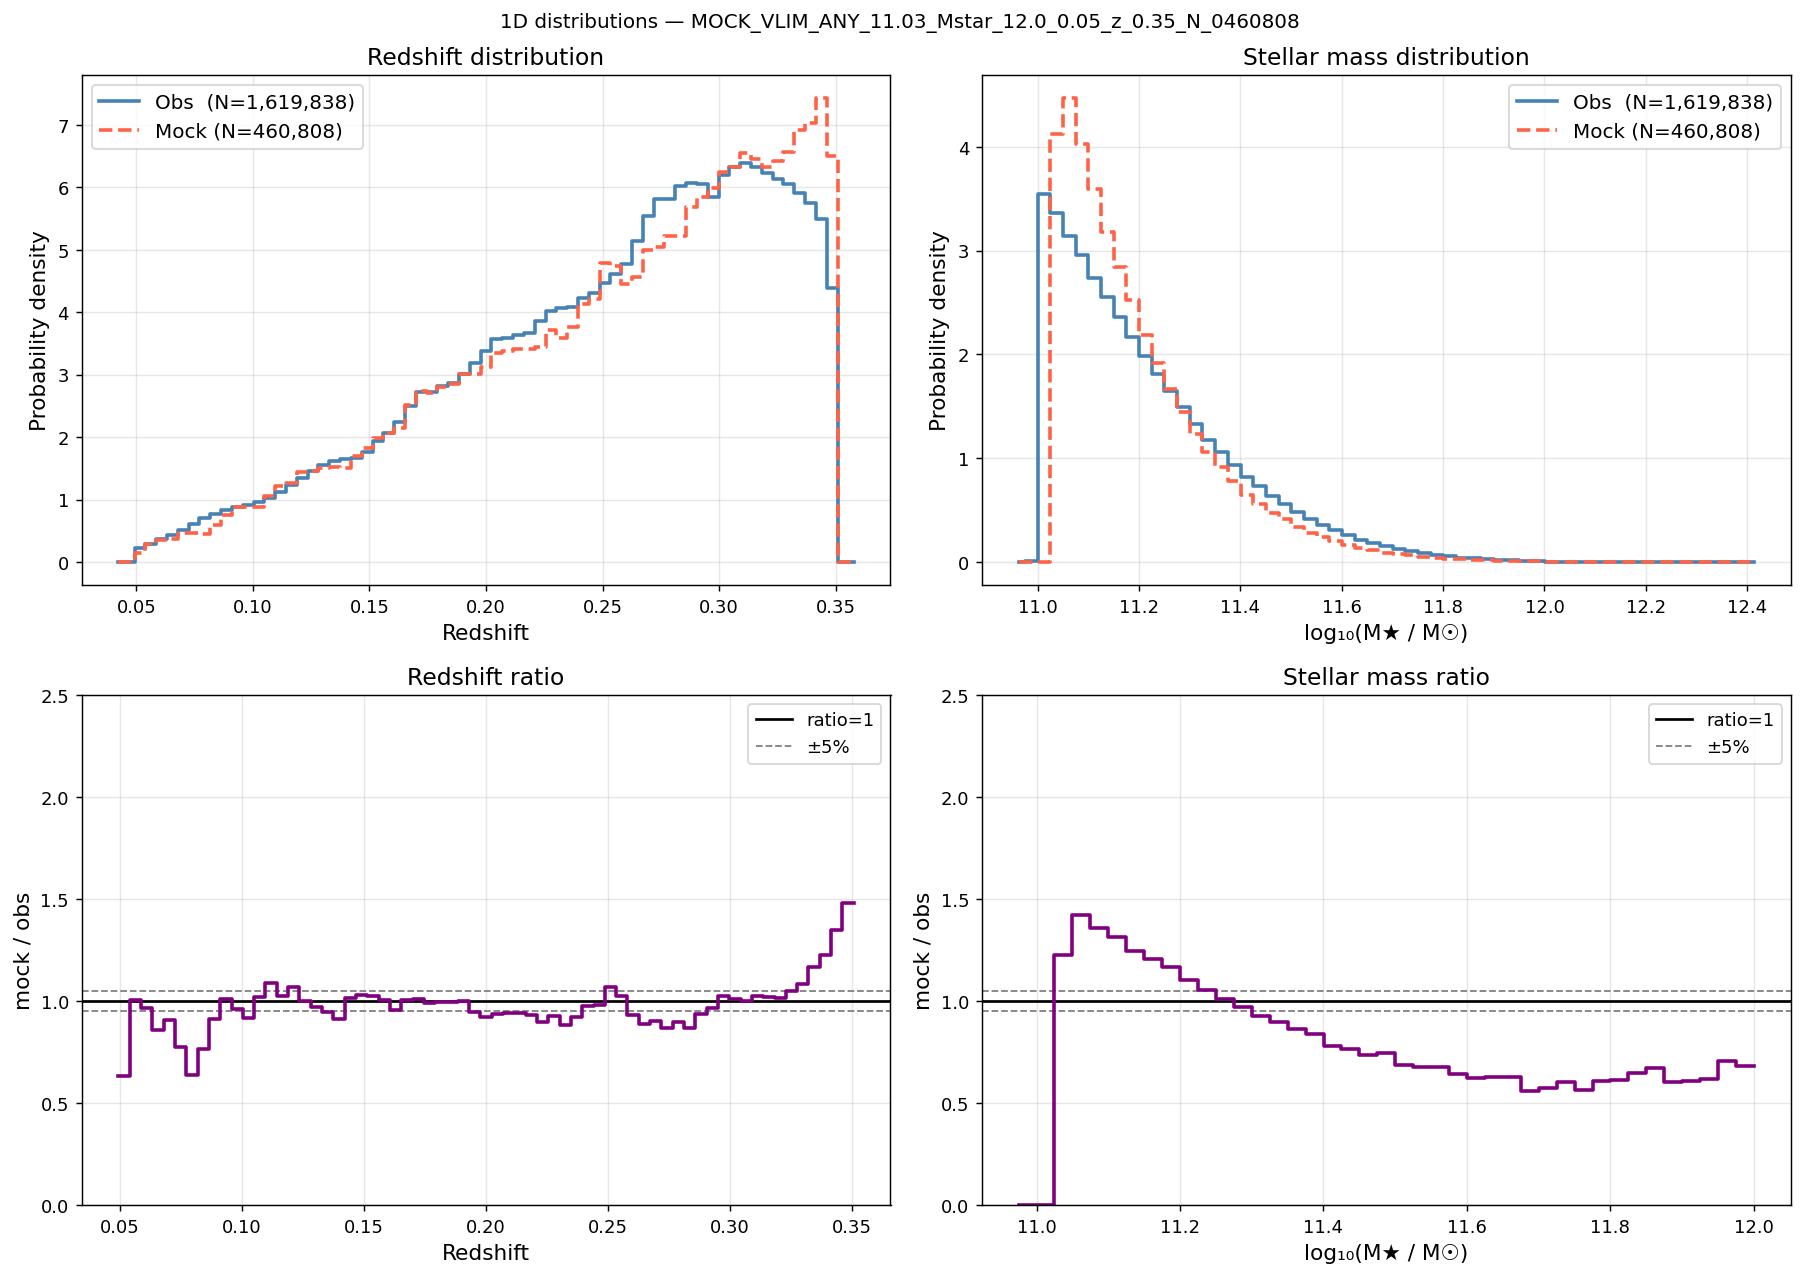
Redshift (left) and stellar-mass (right) distributions for the M★≥11.03 mock.
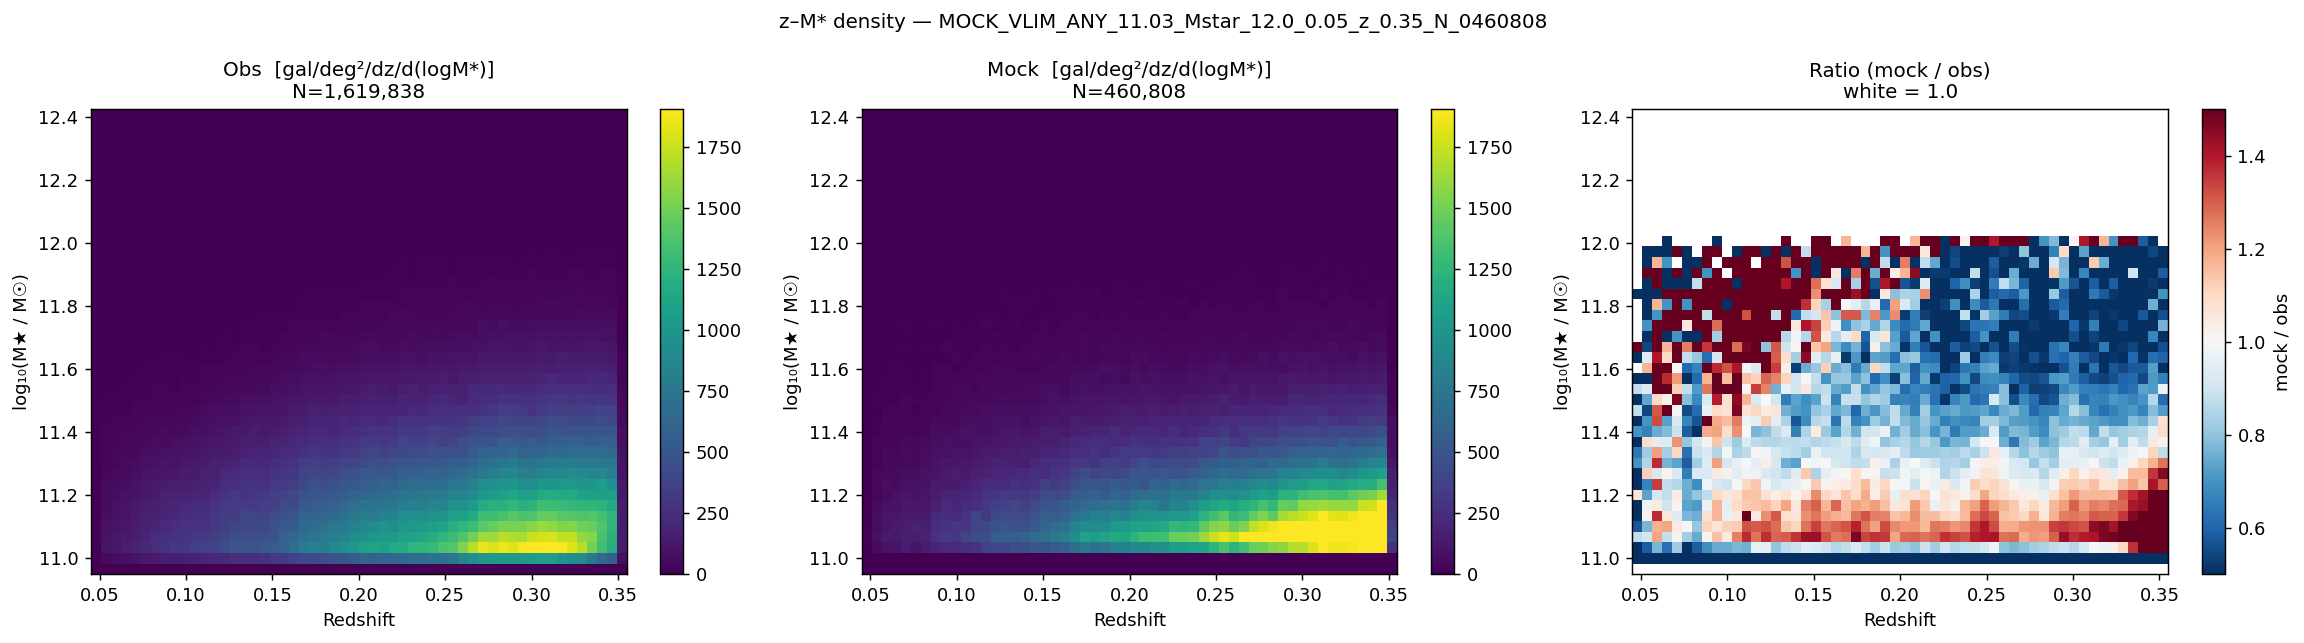
Stellar-mass vs. redshift plane for the M★≥11.03 mock and the corresponding BGS sample.
M★ ≥ 11.22 (N = 157 946, z < 0.35)
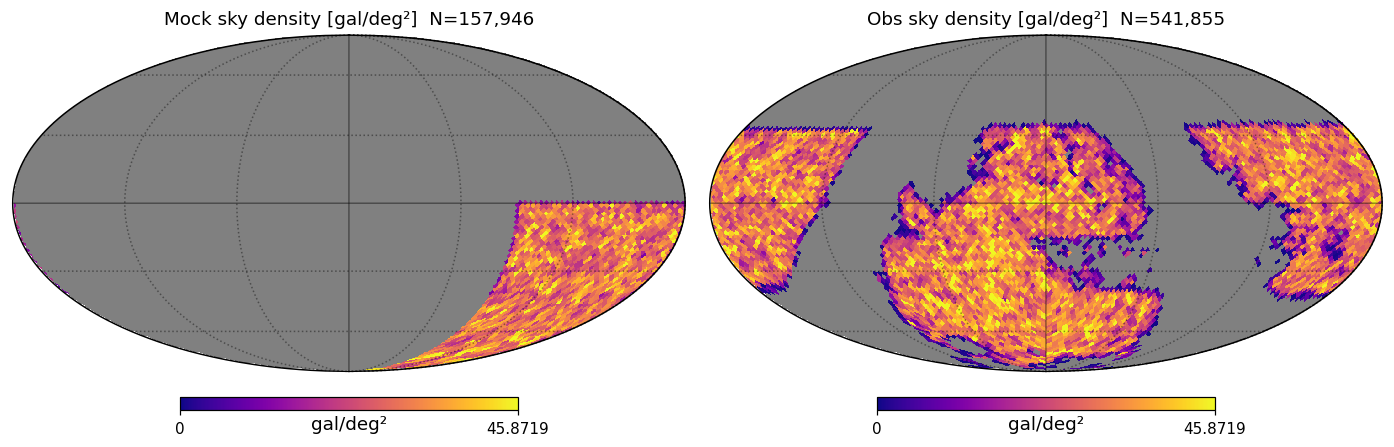
Sky footprint (RA/Dec) of the M★≥11.22 mock.
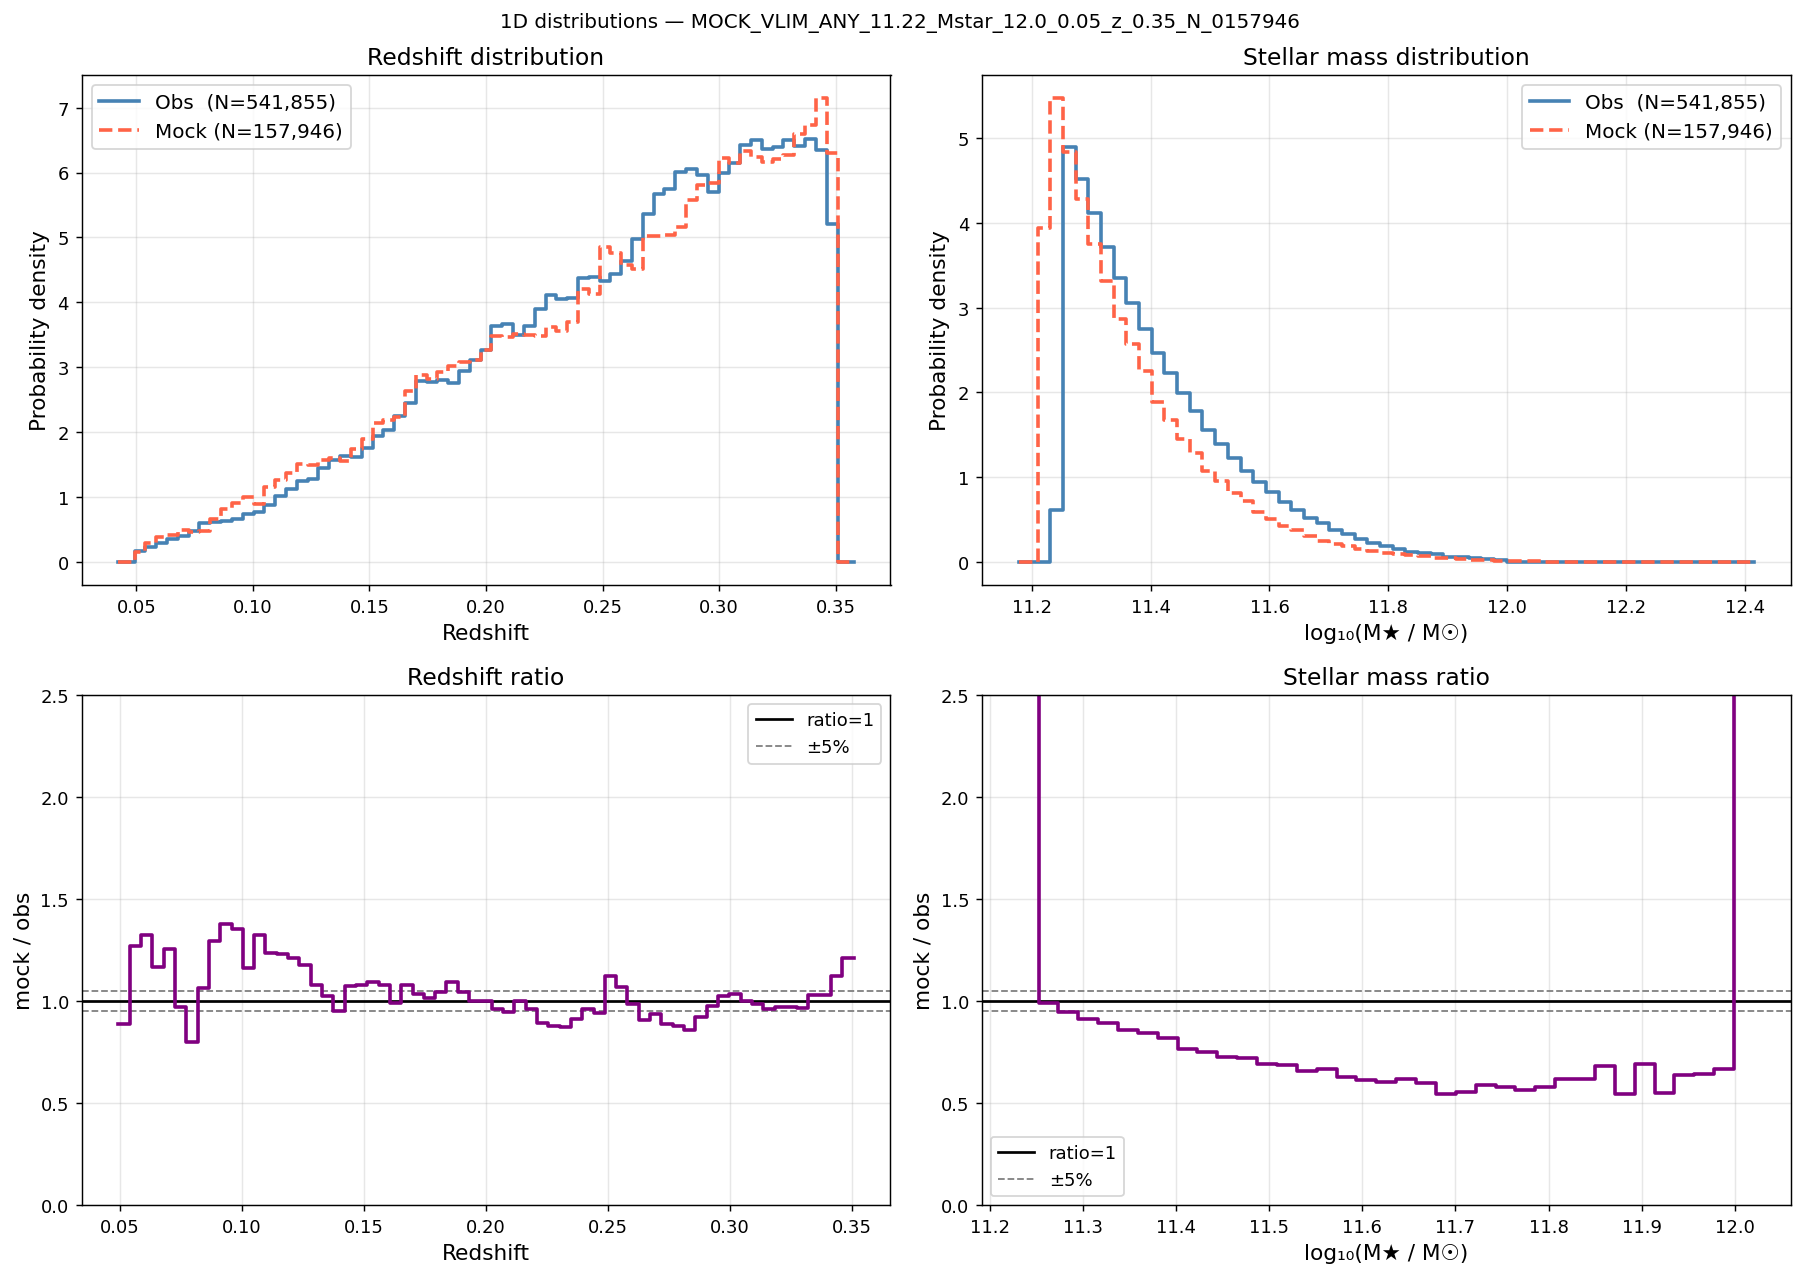
Redshift (left) and stellar-mass (right) distributions for the M★≥11.22 mock.
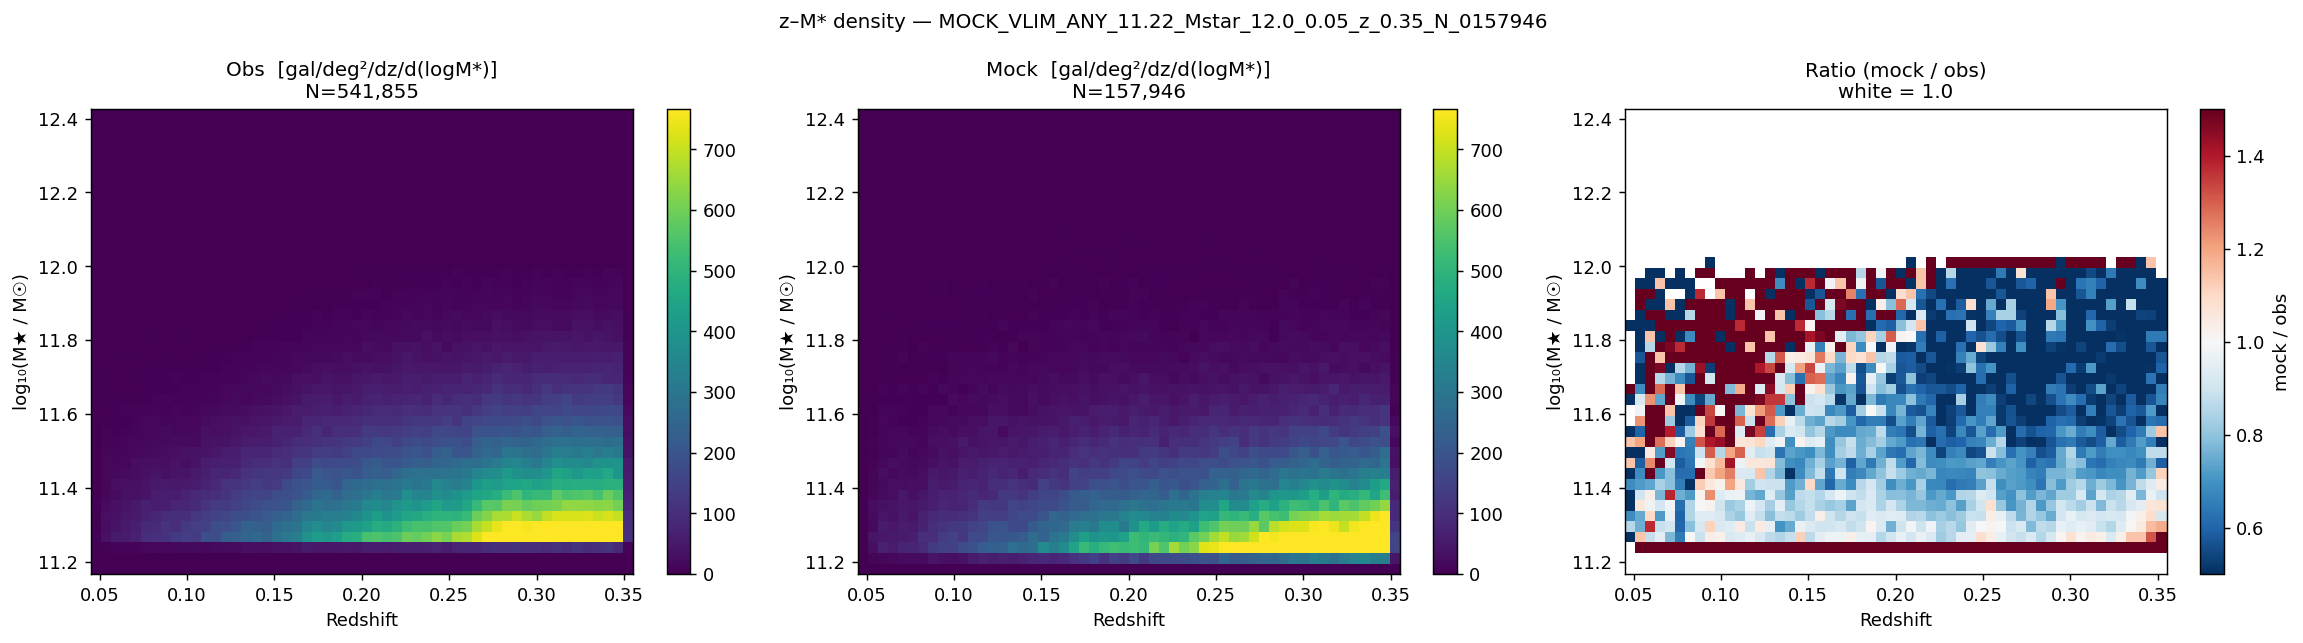
Stellar-mass vs. redshift plane for the M★≥11.22 mock and the corresponding BGS sample.
M★ ≥ 11.39 (N = 50 067, z < 0.35)
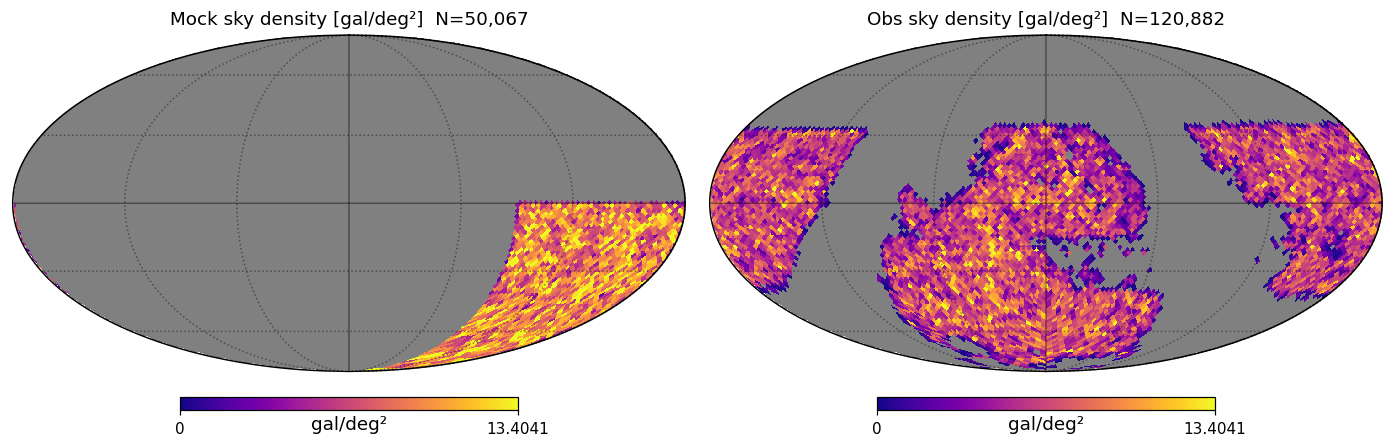
Sky footprint (RA/Dec) of the M★≥11.39 mock.
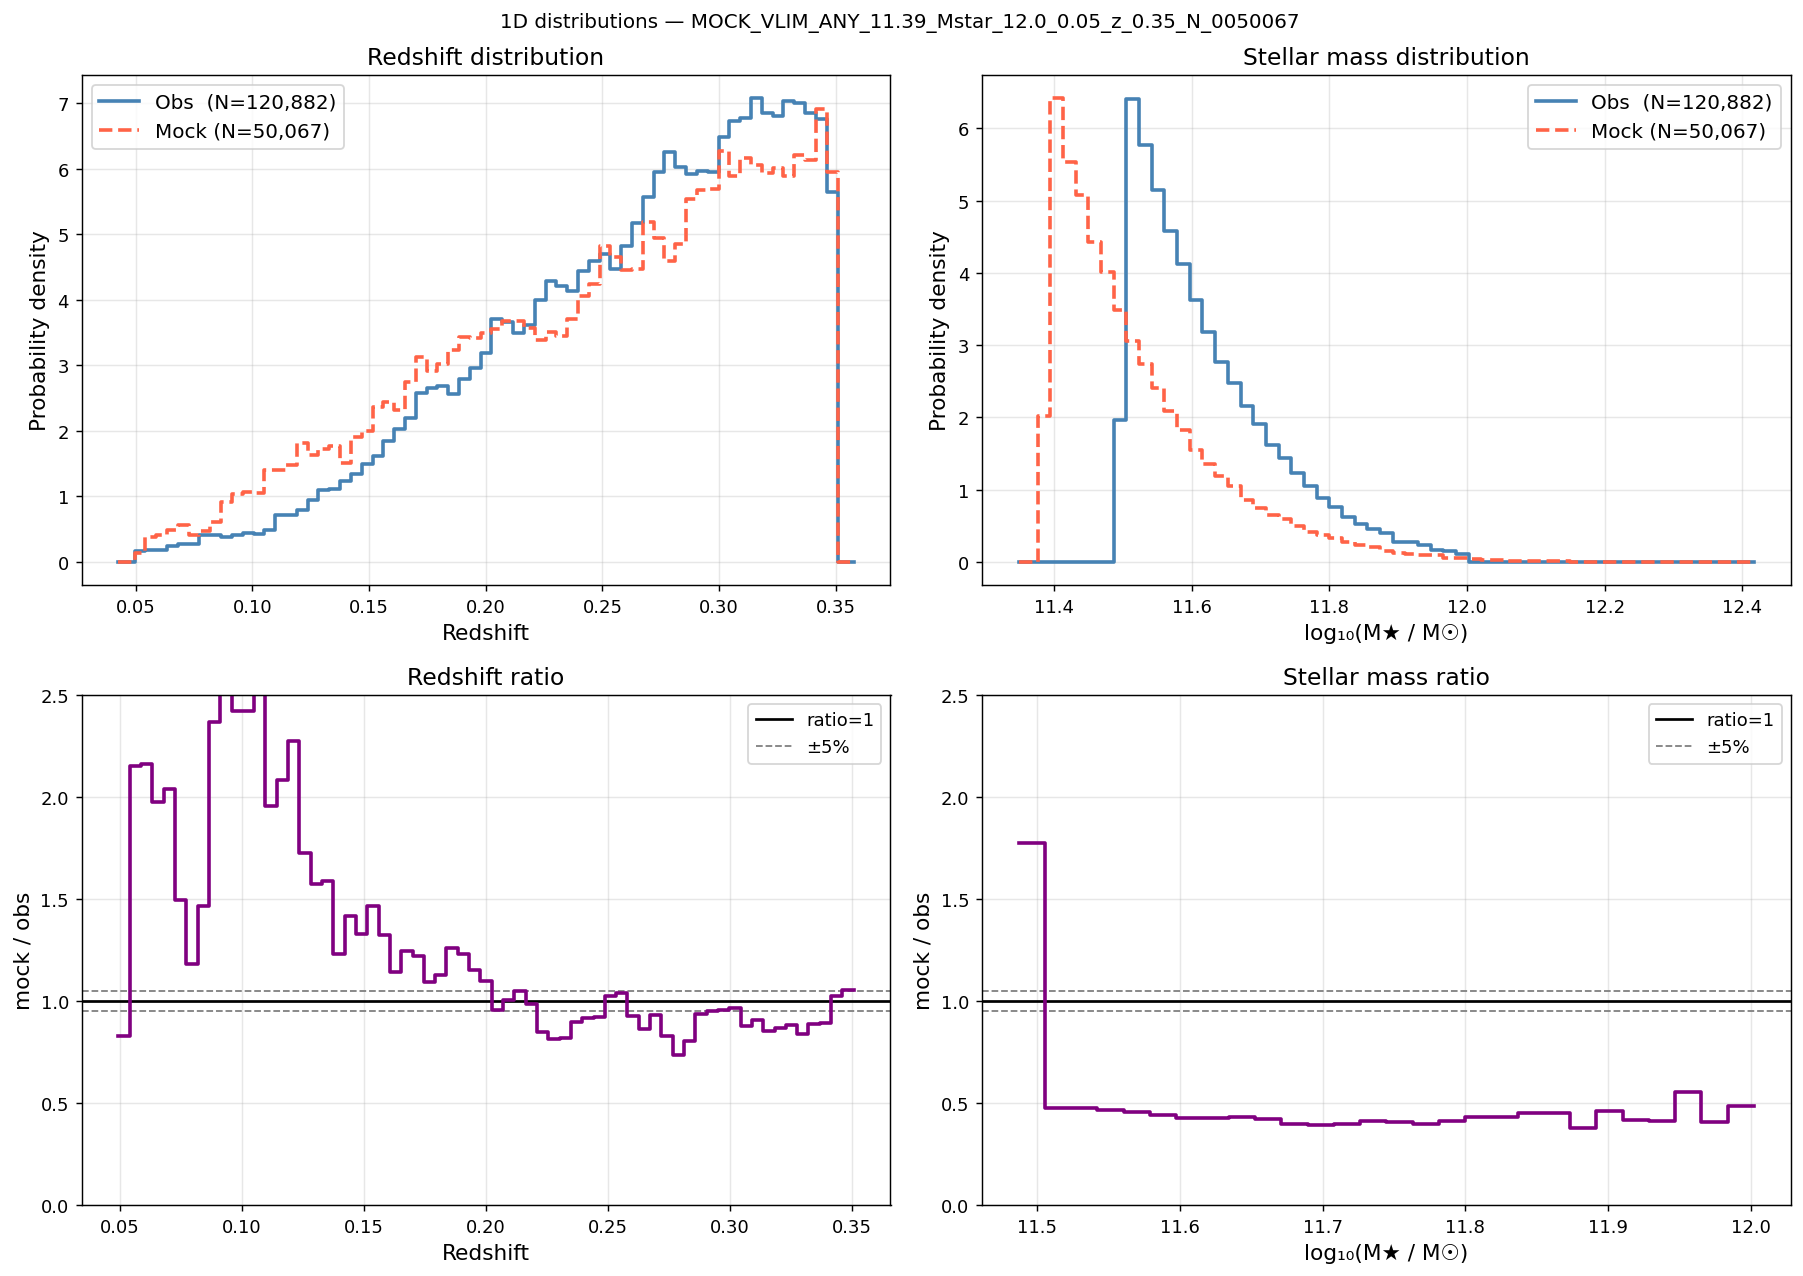
Redshift (left) and stellar-mass (right) distributions for the M★≥11.39 mock.
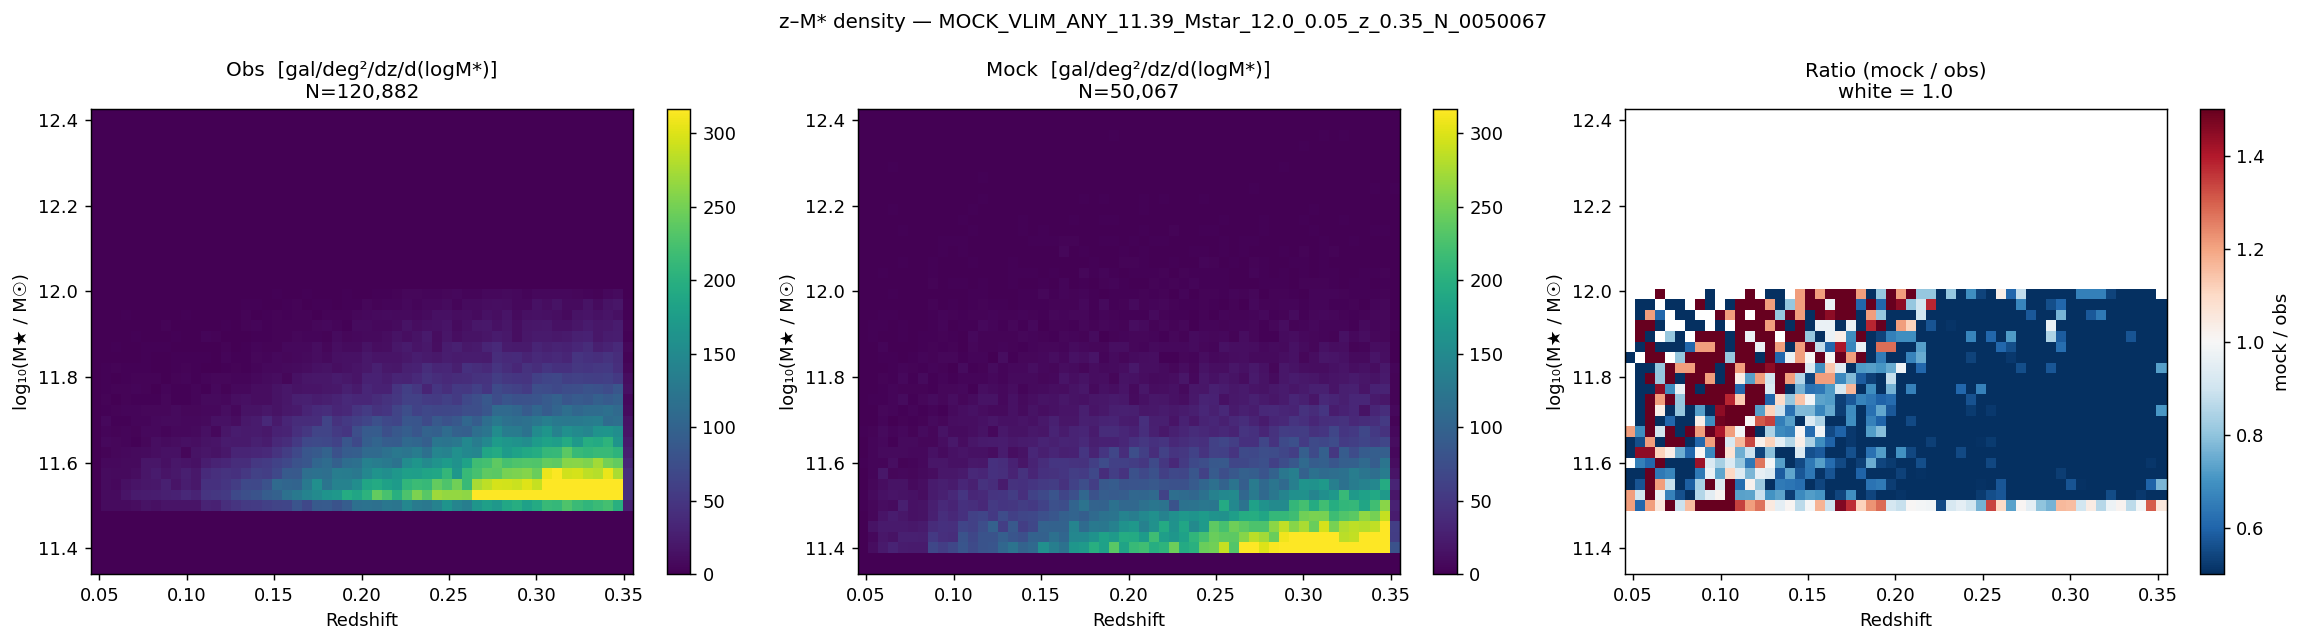
Stellar-mass vs. redshift plane for the M★≥11.39 mock and the corresponding BGS sample.
Stellar mass function
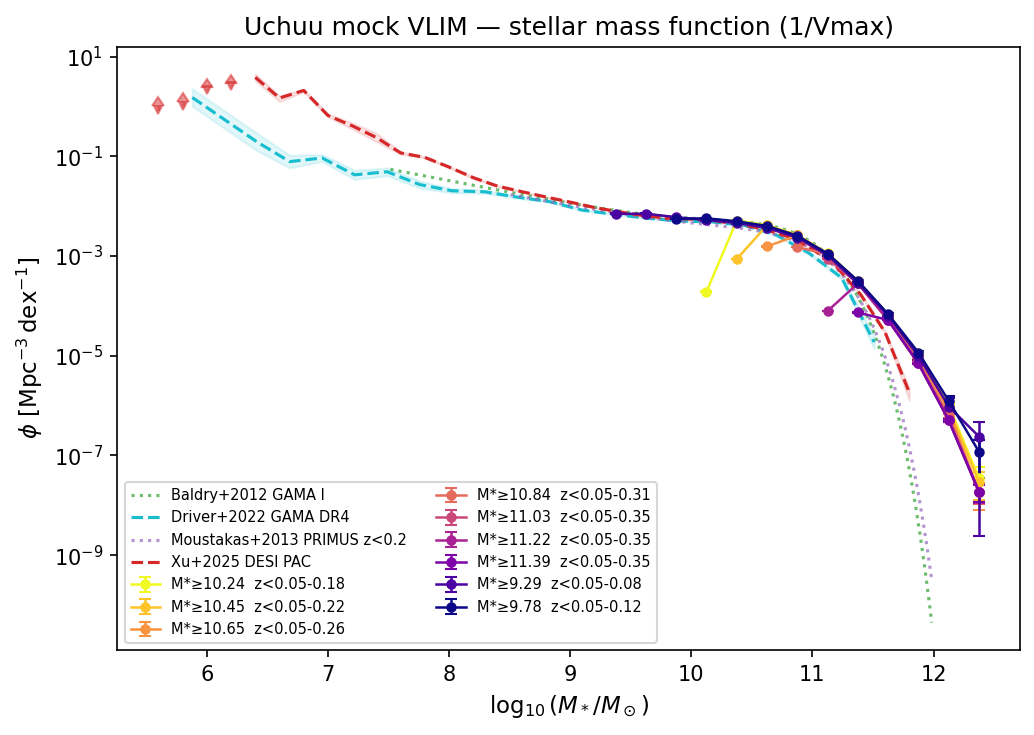
Stellar mass function φ(M★) for all 9 Uchuu mock VLIM samples, estimated with the 1/Vmax method (coloured markers with jackknife errors). The cosmological area (5 156.6 deg²) is used for normalisation. Literature references overlaid as dashed/dotted lines: Baldry+2012 GAMA I, Driver+2022 GAMA DR4, Moustakas+2013 PRIMUS z<0.2, Xu+2025 DESI PAC (shaded band). See Literature Benchmarks for provenance.
SMF key values at the lowest complete stellar mass bin:
Sample |
log₁₀M★_min |
z_max |
log₁₀M★_ref [dex] |
φ [Mpc⁻³ dex⁻¹] |
|---|---|---|---|---|
MOCK_VLIM_ANY_Mstar9.29 |
9.29 |
0.08 |
9.38 |
7.00 × 10⁻³ ± 1.6 × 10⁻⁴ |
MOCK_VLIM_ANY_Mstar9.78 |
9.78 |
0.12 |
9.88 |
5.53 × 10⁻³ ± 9.2 × 10⁻⁵ |
MOCK_VLIM_ANY_Mstar10.24 |
10.24 |
0.18 |
10.12 |
1.92 × 10⁻⁴ ± 2.9 × 10⁻⁶ |
MOCK_VLIM_ANY_Mstar10.45 |
10.45 |
0.22 |
10.38 |
8.67 × 10⁻⁴ ± 1.1 × 10⁻⁵ |
MOCK_VLIM_ANY_Mstar10.65 |
10.65 |
0.26 |
10.62 |
1.56 × 10⁻³ ± 1.6 × 10⁻⁵ |
MOCK_VLIM_ANY_Mstar10.84 |
10.84 |
0.31 |
10.88 |
1.51 × 10⁻³ ± 1.3 × 10⁻⁵ |
MOCK_VLIM_ANY_Mstar11.03 |
11.03 |
0.35 |
11.12 |
8.84 × 10⁻⁴ ± 9.2 × 10⁻⁶ |
MOCK_VLIM_ANY_Mstar11.22 |
11.22 |
0.35 |
11.12 |
7.88 × 10⁻⁵ ± 8.9 × 10⁻⁷ |
MOCK_VLIM_ANY_Mstar11.39 |
11.39 |
0.35 |
11.38 |
7.38 × 10⁻⁵ ± 9.2 × 10⁻⁷ |
Angular correlation function w(θ)
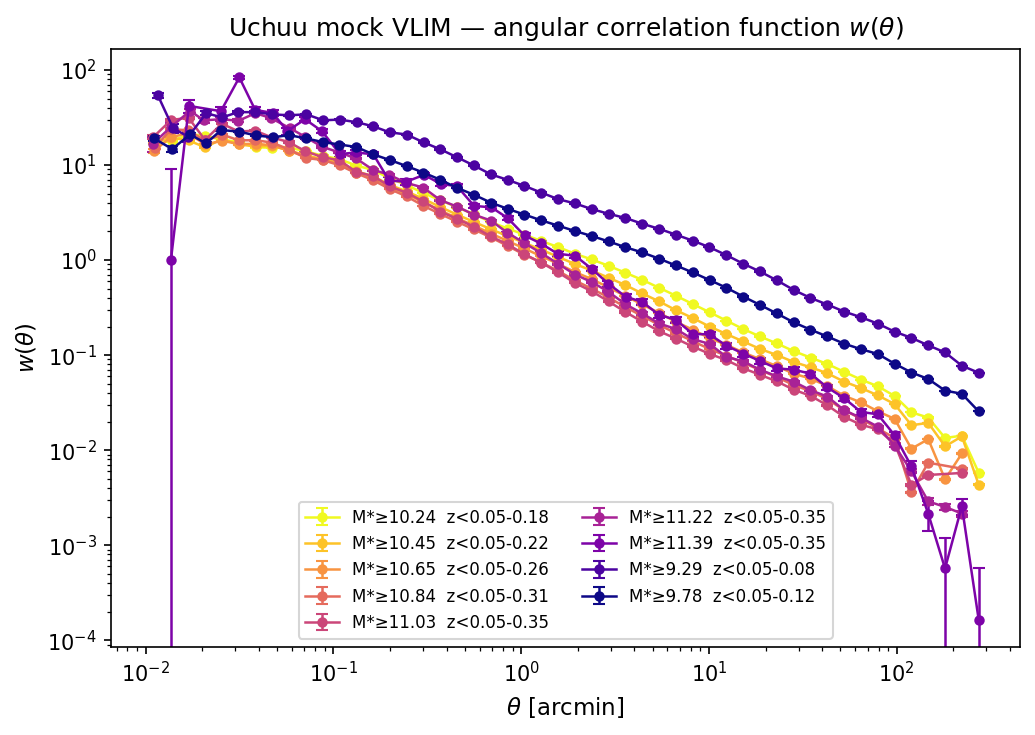
Angular two-point correlation function w(θ) for all 9 mock samples, measured with the Landy–Szalay estimator. Error bars are TreeCorr variance estimates. Bins: 30 log-spaced bins in [0.01, 60] arcmin.
Projected correlation function wp(rp)
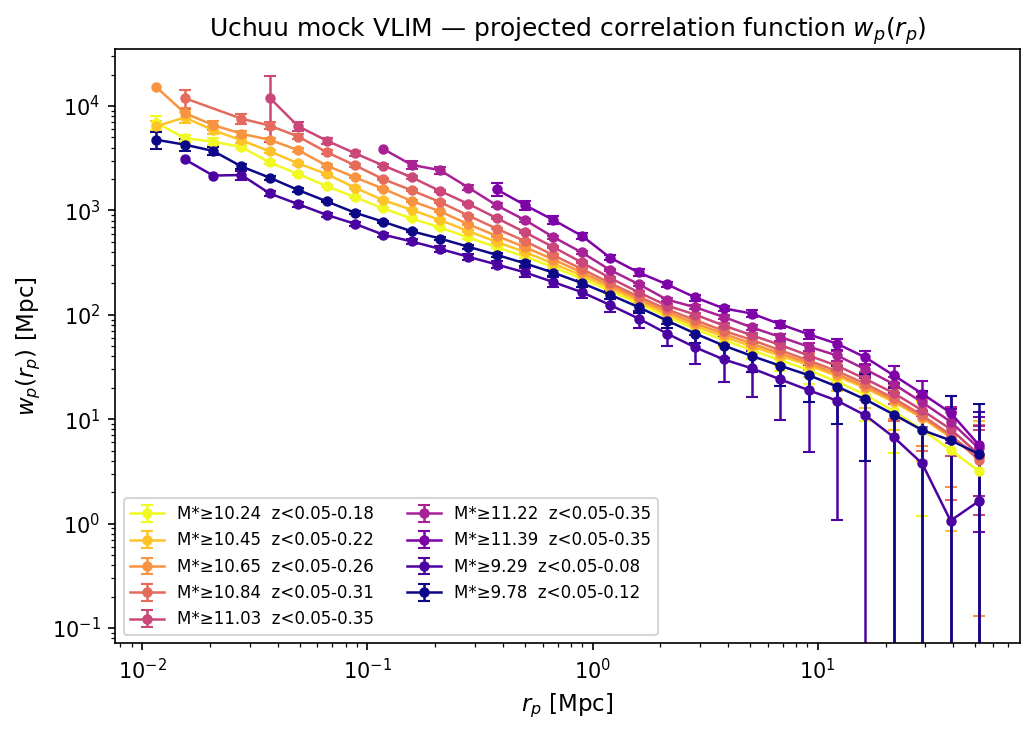
Projected correlation function wp(rp) for all 9 mock samples (πmax = 100 Mpc), measured with Corrfunc Landy–Szalay. Error bars are jackknife uncertainties from the joint covariance. Bins: 30 log-spaced bins in [0.01, 60] Mpc.
Representative wp(rp) values at rp = 1 Mpc and 10 Mpc (from the joint covariance files, uniform weights):
Sample |
log₁₀M★_min |
wp(1 Mpc) [Mpc] |
wp(10 Mpc) [Mpc] |
|---|---|---|---|
MOCK_VLIM_ANY_Mstar9.29 |
9.29 |
164.8 ± 20.5 |
19.0 ± 14.1 |
MOCK_VLIM_ANY_Mstar9.78 |
9.78 |
201.4 ± 15.7 |
26.4 ± 11.8 |
MOCK_VLIM_ANY_Mstar10.24 |
10.24 |
222.6 ± 10.5 |
29.6 ± 7.8 |
MOCK_VLIM_ANY_Mstar10.45 |
10.45 |
238.6 ± 8.4 |
32.9 ± 7.3 |
MOCK_VLIM_ANY_Mstar10.65 |
10.65 |
255.1 ± 7.2 |
34.5 ± 5.2 |
MOCK_VLIM_ANY_Mstar10.84 |
10.84 |
274.8 ± 8.3 |
36.5 ± 6.7 |
MOCK_VLIM_ANY_Mstar11.03 |
11.03 |
317.4 ± 6.8 |
40.7 ± 3.9 |
MOCK_VLIM_ANY_Mstar11.22 |
11.22 |
395.7 ± 11.8 |
49.5 ± 4.4 |
MOCK_VLIM_ANY_Mstar11.39 |
11.39 |
571.4 ± 40.7 |
65.1 ± 6.6 |
Joint SMF + wp covariance
The joint covariance matrix is estimated with 100-region spatial jackknife resampling. The data vector is \(\mathbf{d} = [\phi_1,\ldots,\phi_{N_\mathrm{SMF}},\, w_p^1,\ldots,w_p^{N_{w_p}}]\).
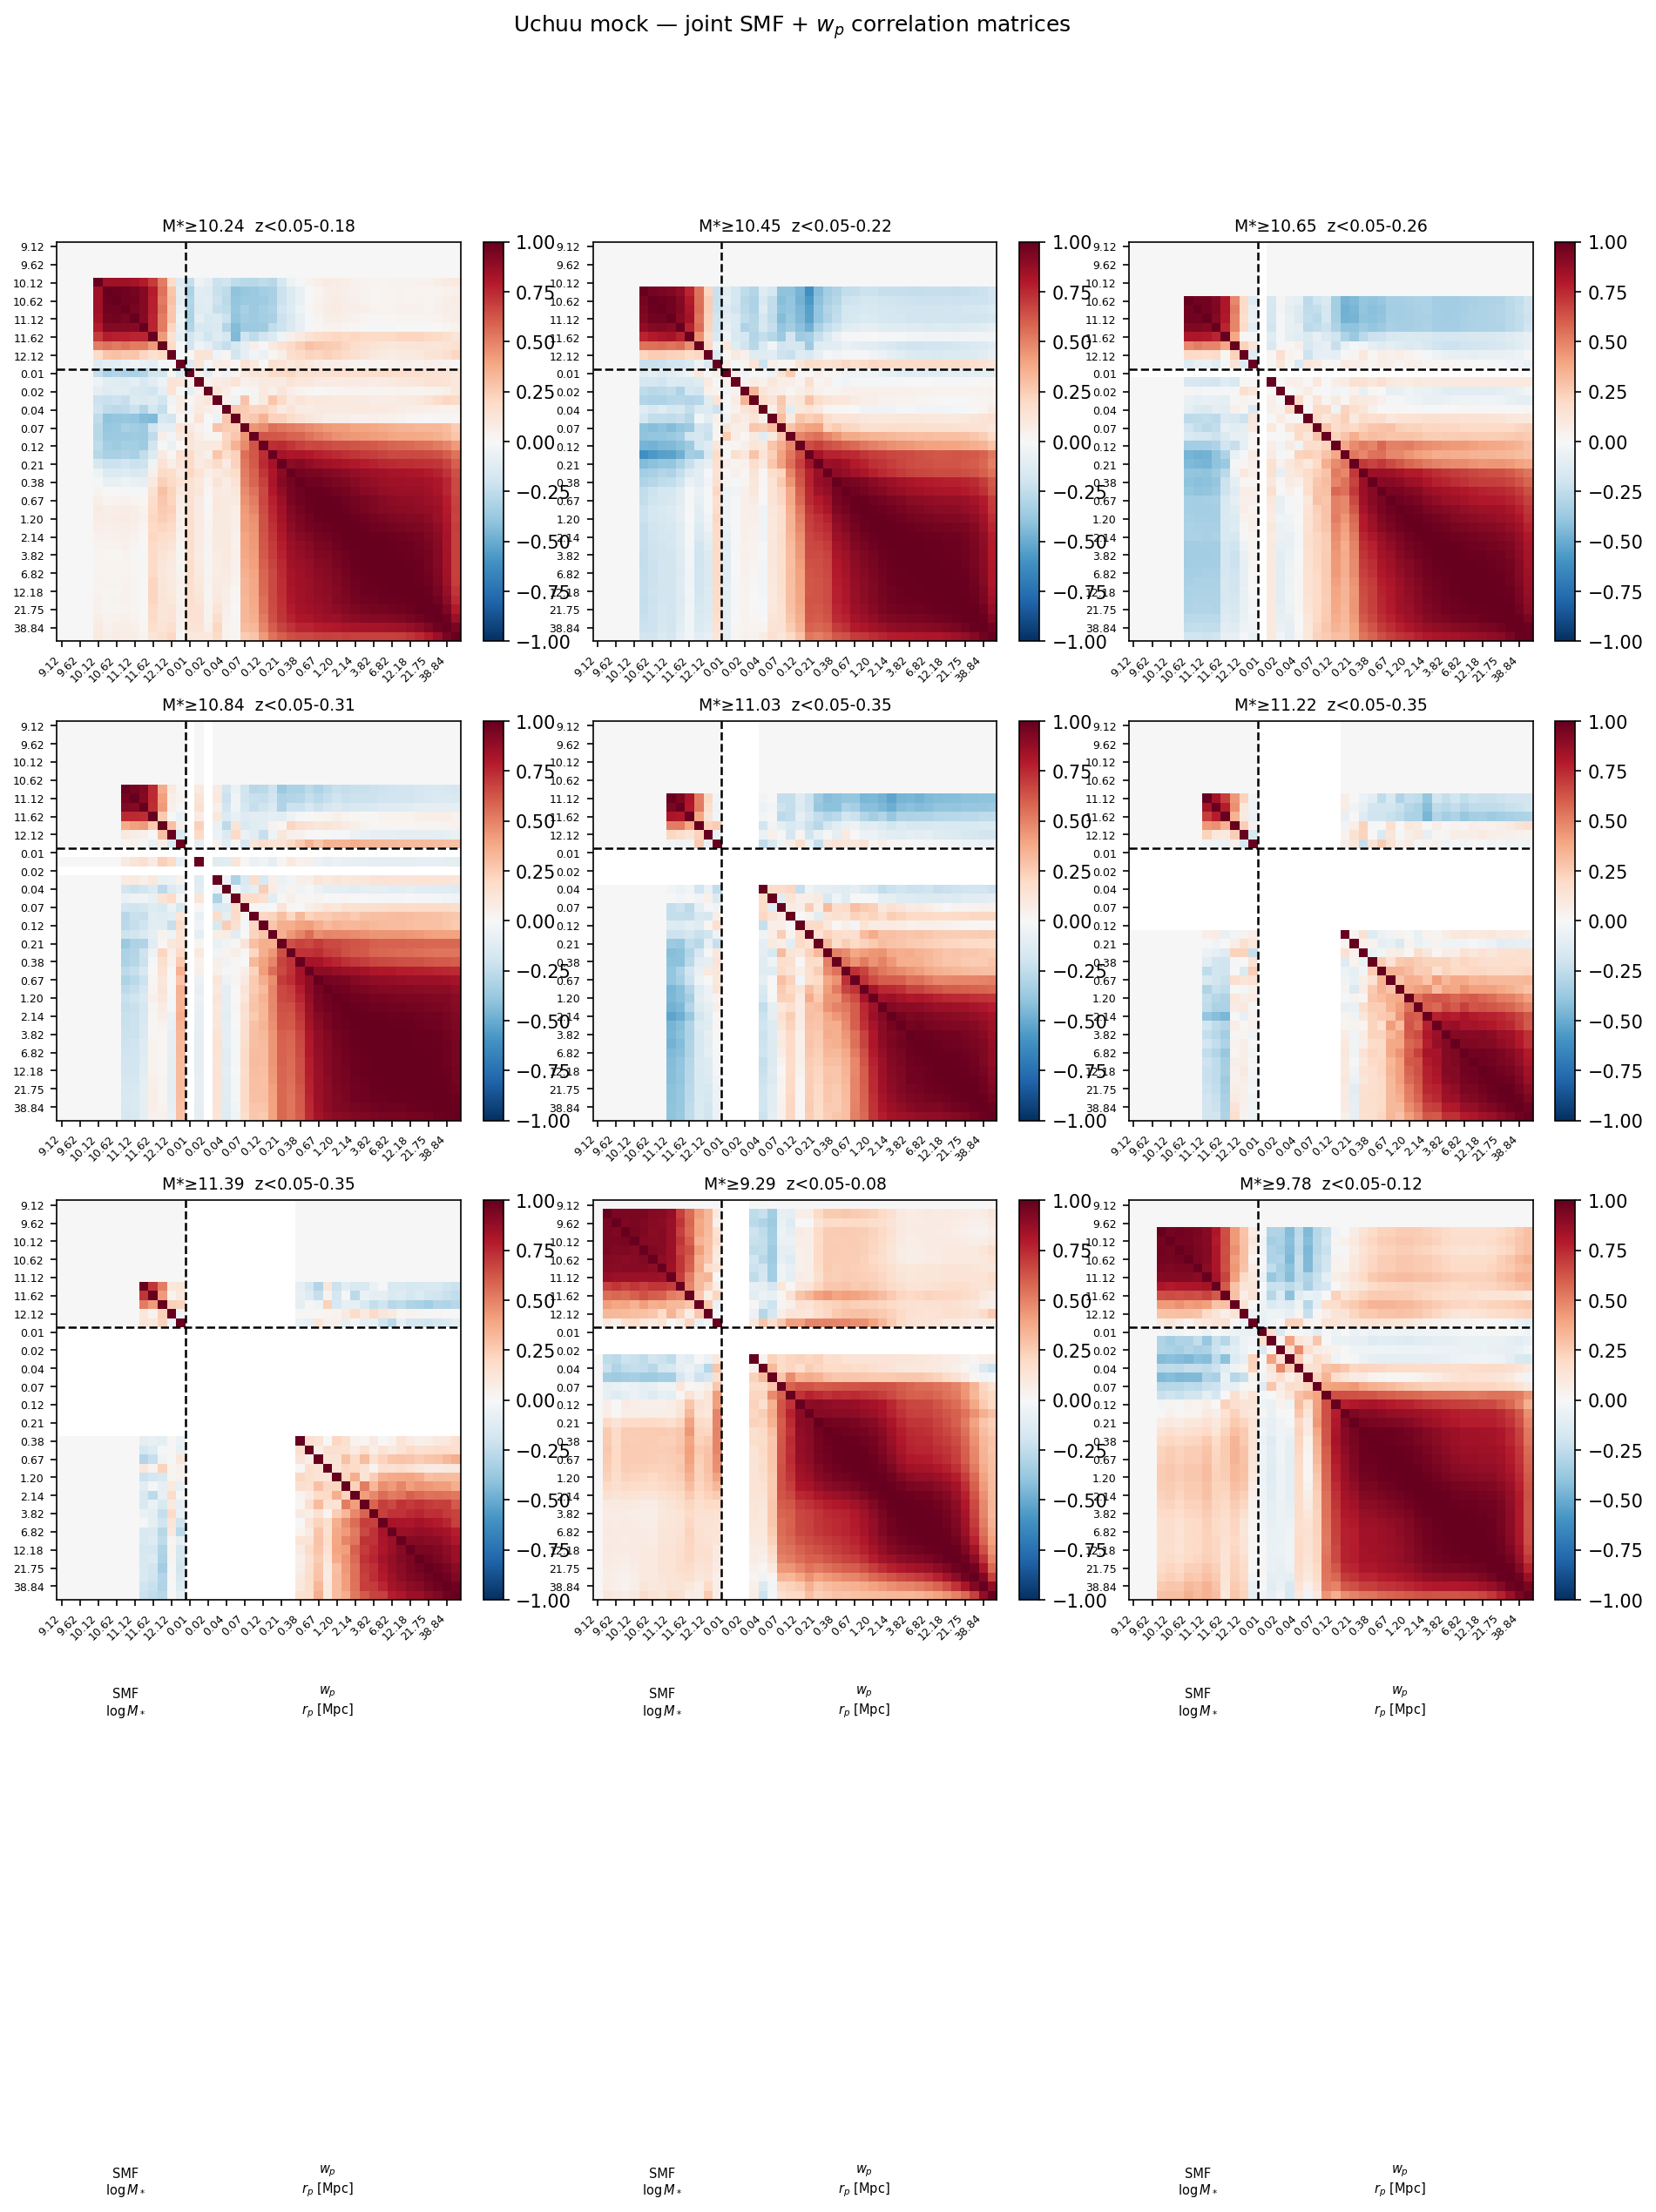
Pearson correlation matrices of the joint SMF + wp data vector for all 9 mock samples. The dashed line separates the SMF (top-left) from the wp (bottom-right) blocks. Off-diagonal cross-correlations encode the covariance between the two statistics.
Regenerating figures
After new results are available, re-run:
python docs/scripts/make_run_figures.py
cd docs && make html