Galaxy Clustering
Sixty published galaxy clustering measurements catalogued in
literature_measurements/clustering/, organised by statistic.
The collection covers seven two-point statistics:
wprp (projected correlation function),
wtheta (angular correlation function),
xi_multipoles (redshift-space multipoles),
Pk (galaxy power spectrum),
Pk_multipoles (power spectrum multipoles),
DeltaSigma (excess surface mass density), and
cosmic_shear (shear–shear correlations).
Each entry has a paper.json with full provenance (survey, method,
cosmology, key results per redshift bin).
Conventions: projected correlation function wₚ(rₚ) is in h⁻¹ Mpc; power spectra P(k) in (h⁻¹ Mpc)³; fsigma8 is the growth-rate amplitude. H₀ = 100 h km s⁻¹ Mpc⁻¹ throughout.
Measurement methods
Projected correlation function wₚ(rₚ)
The projected correlation function integrates the 2D redshift-space correlation function ξ(rₚ, π) along the line-of-sight separation π, suppressing the effect of peculiar velocities (redshift-space distortions):
where rₚ is the transverse (projected) separation and πmax is the integration limit, chosen large enough to include all correlated pairs (typically 40–100 h⁻¹ Mpc).
The Landy-Szalay estimator for ξ(rₚ, π) is:
where DD, DR, and RR are the normalised data-data, data-random, and random-random pair counts. The key advantage over the angular or redshift-space correlation function is that wₚ is insensitive to linear RSD, enabling clean HOD modelling on small scales.
Key code: sum_stat.twopcf.projected. Reference: Davis & Peebles 1983,
ApJ 267, 465.
Angular correlation function w(θ)
The angular two-point correlation function is measured in projected angular separation θ without any redshift information:
(Landy-Szalay estimator projected on the sky). No photo-z accuracy is needed, making it the natural statistic for photometric surveys such as DES and SDSS commissioning. The Limber approximation connects w(θ) to the 3D matter power spectrum P_m(k) through the redshift distribution n(z) of the sample.
Key code: sum_stat.twopcf.angular.
Redshift-space multipoles ξ_ℓ(s)
The redshift-space correlation function can be decomposed into Legendre multipoles:
where s is the redshift-space separation, μ = cos θ is the cosine of the angle to the line of sight, and ℓ = 0, 2, 4 are the monopole, quadrupole, and hexadecapole. In the linear (Kaiser 1987) limit:
where β = f/b is the ratio of the linear growth rate f to the linear galaxy bias b. The multipoles encode both RSD (growth rate fσ₈) and BAO (the standard ruler from the baryon acoustic oscillation in the matter power spectrum).
Key code: sum_stat.twopcf.multipoles. References: Kaiser 1987, MNRAS
227, 1; Hamilton 1992, ApJ 385, L5.
Power spectrum P(k)
The galaxy power spectrum is estimated as the Fourier transform of the density field:
where \(\delta_k\) are the Fourier modes of the galaxy overdensity field δ(r) = n(r)/n̄ − 1 and V is the survey volume. In practice, window function deconvolution is required to correct for the survey geometry, and FKP weighting (Feldman, Kaiser & Peacock 1994) is applied to optimise the signal-to-noise:
where P₀ is a reference power spectrum amplitude and n̄(r) is the expected mean galaxy density.
Key code: sum_stat.powspec.pk3d. Reference: Feldman, Kaiser & Peacock
1994, ApJ 426, 23.
Power spectrum multipoles P_ℓ(k)
As with the correlation function, the anisotropic power spectrum can be decomposed into Legendre multipoles P₀(k), P₂(k), P₄(k). This captures both RSD and BAO simultaneously in a single compressed statistic.
Modelling is performed with the Effective Field Theory of Large Scale Structure (EFTofLSS; Perko et al. 2016; Ivanov+2020) or the TNS model (Taruya, Nishimichi & Saito 2010) for the non-linear power spectrum. The EFT approach has become the standard for BOSS DR12 and DESI DR1 full-shape analyses.
Status and open questions
Large-scale growth rate
On large scales (s > 20 h⁻¹ Mpc, k < 0.1 h Mpc⁻¹), the linear growth rate fσ₈(z) is now measured to 2–3% precision from the combination of BOSS DR12 + eBOSS across 0 < z < 2.4 (Alam+2021). The combined constraints are consistent with general relativity (GR) to ~5%, providing one of the most stringent tests of gravity on cosmological scales. DESI DR1 (2024) extends this to 6 galaxy tracers spanning 0.1 < z < 2.33, with fσ₈ constraints that will eventually surpass BOSS at all redshifts.
Small-scale clustering and baryonic effects
On small scales (rₚ < 1 h⁻¹ Mpc, the 1-halo term), galaxy clustering measurements from different surveys show 10–30% discrepancies. The main culprits are:
Fiber collisions: SDSS and BOSS fibers cannot be placed within 55 arcsec of each other, causing correlated losses of pairs at small separations. Correction methods (angular upweighting, nearest-neighbour assignments) have 5–15% residual uncertainty.
Baryonic feedback: supernova- and AGN-driven winds modify halo profiles and the satellite distribution on scales < 1 Mpc, causing deviations from DMO predictions at the 10–30% level.
Photometric scatter: stellar mass estimates carry ~0.15–0.2 dex scatter, which smooths out the clustering signal across stellar mass bins.
Assembly bias
Galaxies with the same halo mass but different halo formation histories (concentration, spin, formation time) cluster differently, a phenomenon known as assembly bias (Gao, Springel & White 2005). Standard HOD models assume clustering depends only on halo mass, and ignoring assembly bias introduces a systematic error of ~10–20% in the inferred SMHM relation. Assembly bias has been detected at ~2–3σ in SDSS (e.g., Lacerna+2022, Xu & Zheng 2020) and is a potential systematic in all HOD-based analyses, including DESI BGS.
Galaxy-halo connection evolution
The scatter in the SMHM relation (σ_SMHM ~ 0.15–0.20 dex) is well constrained locally from joint wp + ΔΣ analyses (Zu & Mandelbaum 2015). However, its evolution with redshift is uncertain at the 20–30% level above z ~ 0.5, because deep spectroscopic surveys with sufficient volume and clustering signal-to-noise at z > 0.5 are just now becoming available (VIPERS, eBOSS, DESI).
Progress over two decades
2002–2003: 2dFGRS (Cole+2005, Norberg+2002) and SDSS (Tegmark+2004, Blanton+2003) produce the first precise measurements of P(k) shape and wₚ(rₚ) at z ~ 0. The BAO feature in the galaxy power spectrum is detected at ~2σ by Eisenstein+2005 (SDSS LRG). The HOD emerges as the standard framework for interpreting small-scale clustering (Zehavi+2004/2005).
2005: Zehavi+2005 (SDSS DR3) establishes the HOD as the community standard for galaxy–halo connection inference from wₚ(rₚ).
2008: Guzzo+2008 (VVDS, Nature) report the first high-z RSD measurement in Nature at z ~ 0.77, showing that RSD can distinguish between dark energy and modified gravity.
2011–2012: BOSS DR7/DR11 (Anderson+2012) and WiggleZ (Blake+2011) deliver BAO distance measurements to 1–3% precision and fσ₈ to ~10%.
2014–2017: BOSS DR11/DR12 gold standard — Anderson+2014, Samushia+2014, Alam+2017 — delivers BAO to 1% and fσ₈ to 4% at z = 0.32 and z = 0.57, representing the state-of-the-art for clustering cosmology for nearly a decade.
2020–2021: eBOSS DR16 full-shape analyses with EFTofLSS (Ivanov+2020, Philcox & Ivanov 2022) combine BAO + RSD + full-shape P(k) for combined σ₈ and H₀ constraints.
2024: DESI DR1 (5.7M galaxy BAO; Adame+2024) is the largest galaxy clustering dataset, delivering BAO at 6× the statistical power of BOSS across 7 tracers. First full-shape EFTofLSS at DESI precision (Adame+2025).
Survey parameter table
Survey |
Statistic |
z range |
Area (deg²) |
Ngal |
Veff (h-3 Gpc³) |
n̄ (10⁻⁴ h³ Mpc⁻³) |
|---|---|---|---|---|---|---|
2dFGRS |
wprp + Pk |
0 – 0.3 |
2000 |
220 k |
0.04 |
5.5 |
SDSS_DR7 |
wprp + Pk |
0 – 0.22 |
7000 |
200 k |
0.5 |
0.4 |
BOSS_LOWZ |
wprp + ξ |
0.15 – 0.43 |
9000 |
250 k |
0.5 |
0.5 |
BOSS_CMASS |
ξ + Pk |
0.43 – 0.70 |
9000 |
690 k |
1.5 |
0.46 |
eBOSS_LRG |
ξ |
0.6 – 1.0 |
7500 |
174 k |
1.8 |
0.1 |
eBOSS_ELG |
ξ |
0.6 – 1.1 |
1000 |
174 k |
0.9 |
0.19 |
eBOSS_QSO |
ξ |
0.8 – 2.2 |
7500 |
344 k |
4.6 |
0.075 |
DESI_DR1 |
ξ + Pk |
0.1 – 2.1 |
9000 |
5700 k |
18 |
various |
Figures
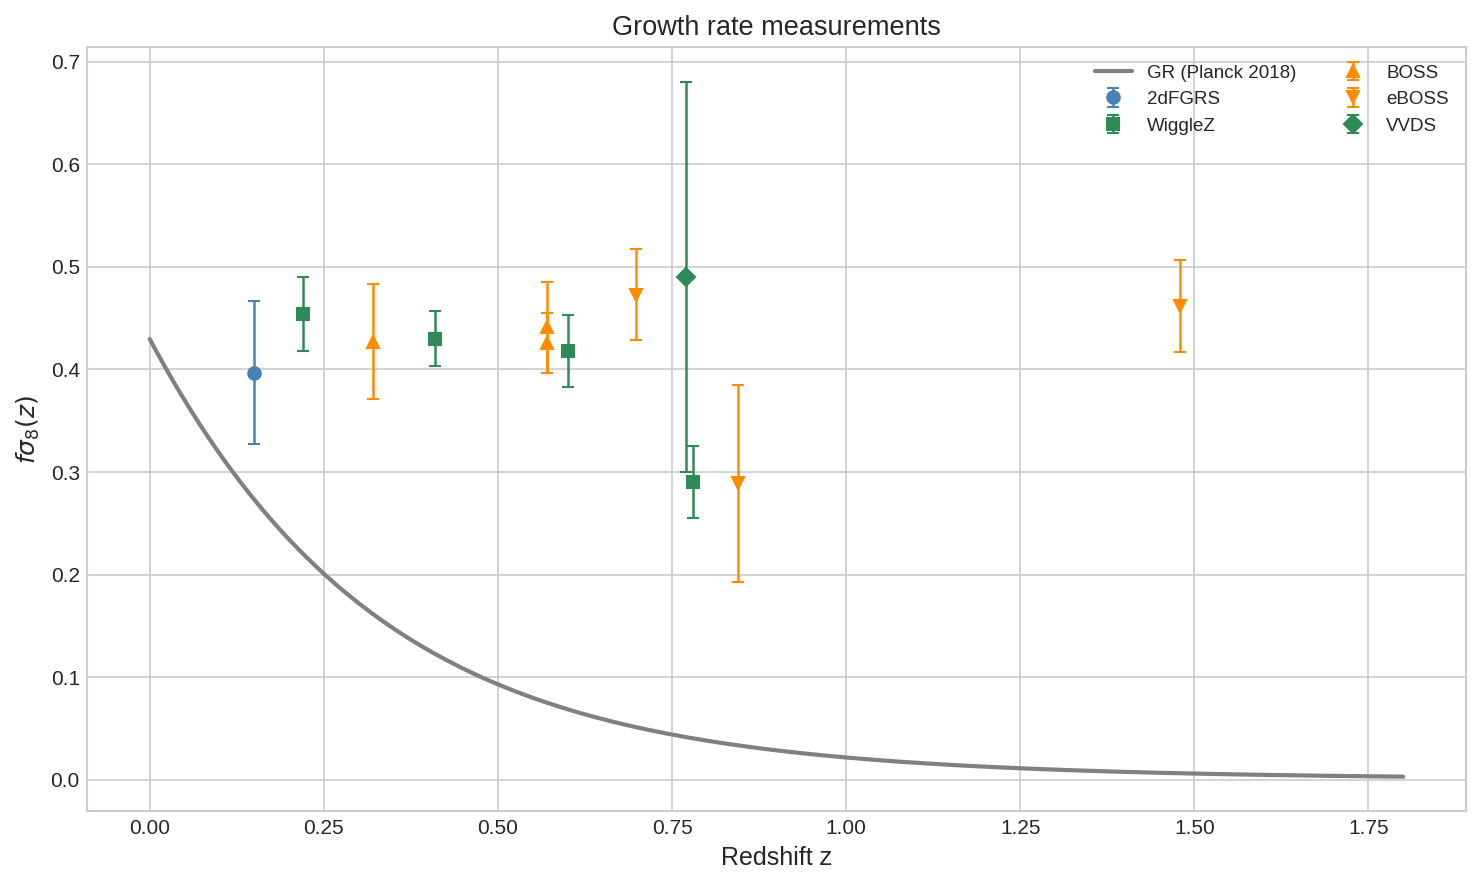
Growth rate fσ₈(z) from all RSD measurements. Grey band: GR prediction (Planck 2018). Points from 2dFGRS, 6dFGS, VVDS, WiggleZ, BOSS LOWZ/CMASS, eBOSS LRG/ELG/QSO, and DESI DR1. (Figure will appear here once the figure script has been run.)
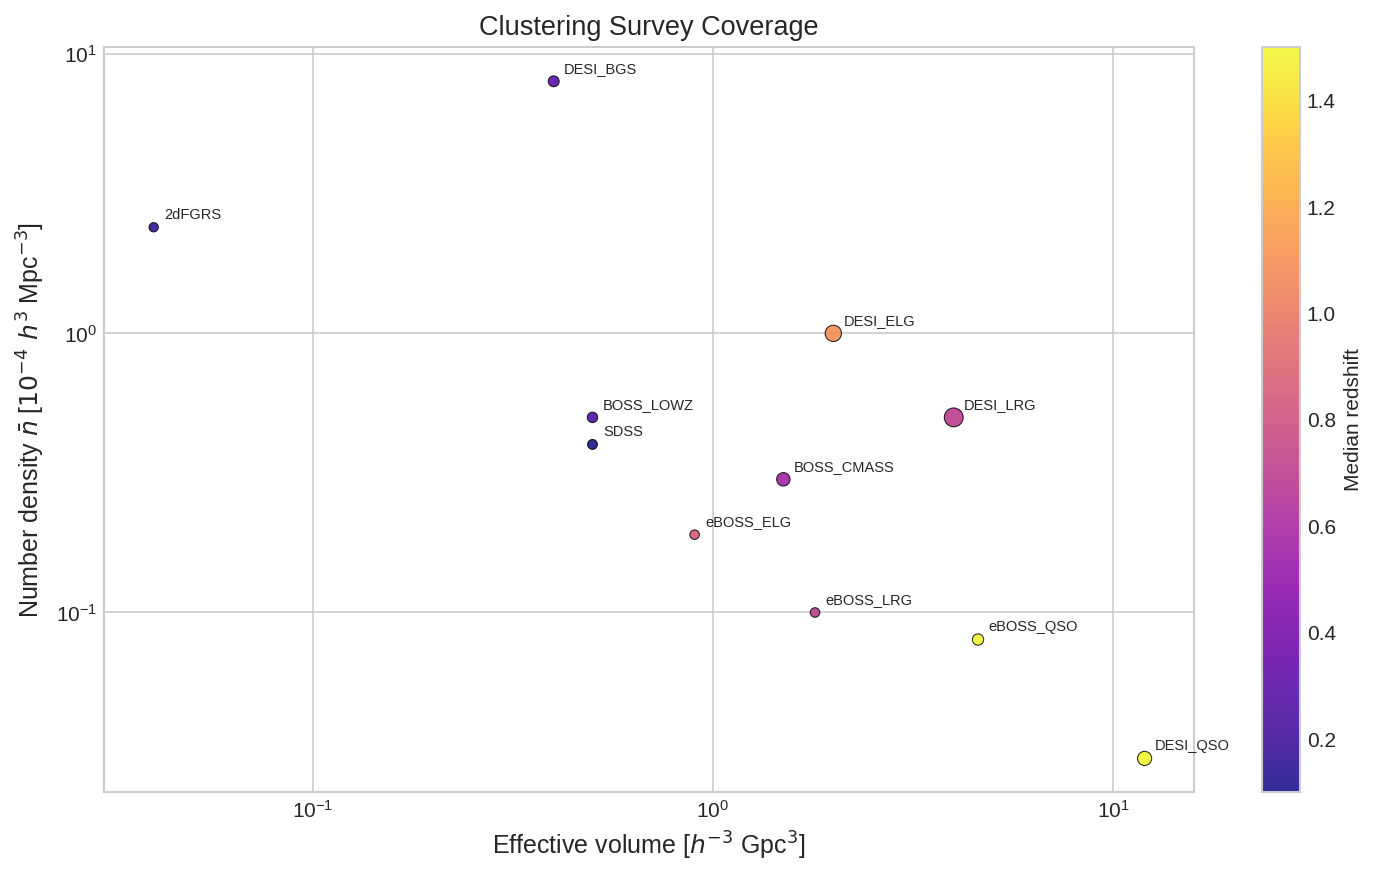
Effective volume V_eff vs mean number density n̄ for galaxy clustering surveys. Symbol size is proportional to √N_gal. (Figure will appear here once the figure script has been run.)
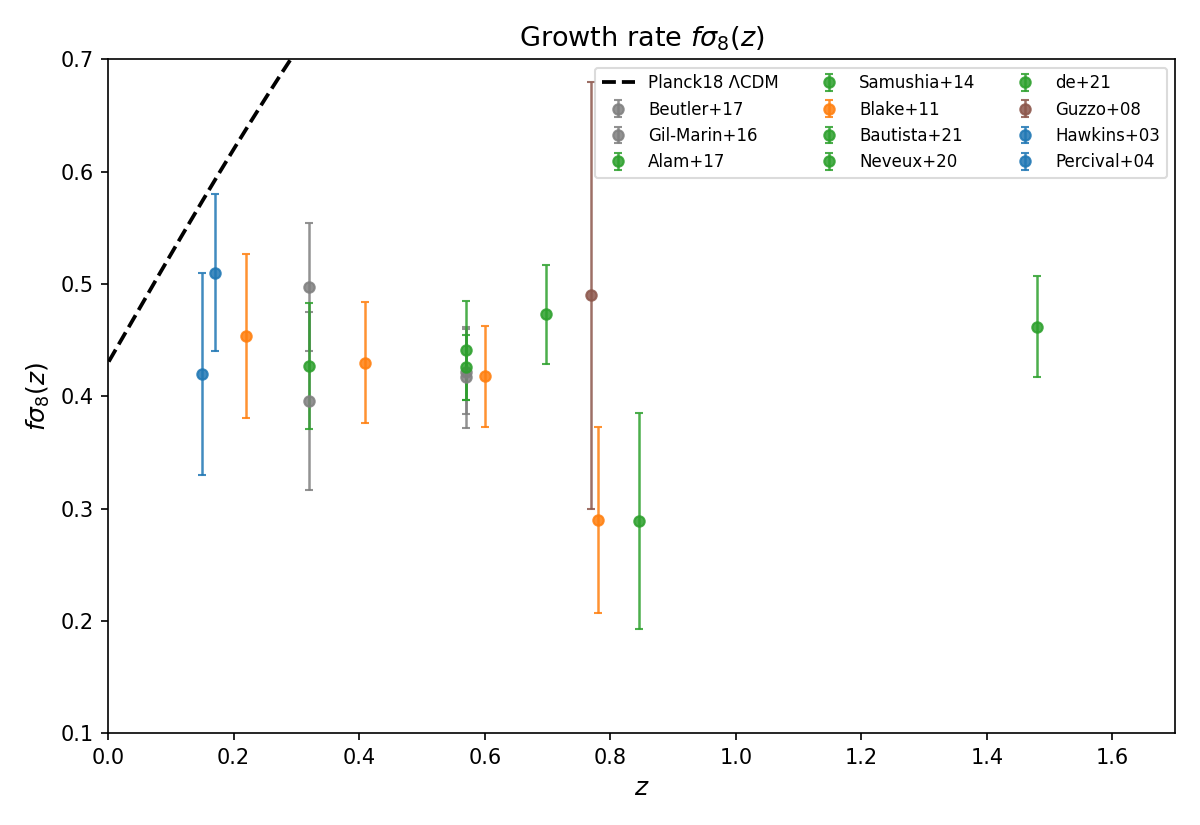
Growth rate fσ₈(z) compiled from 2dFGRS, WiggleZ, BOSS, eBOSS, and DESI.
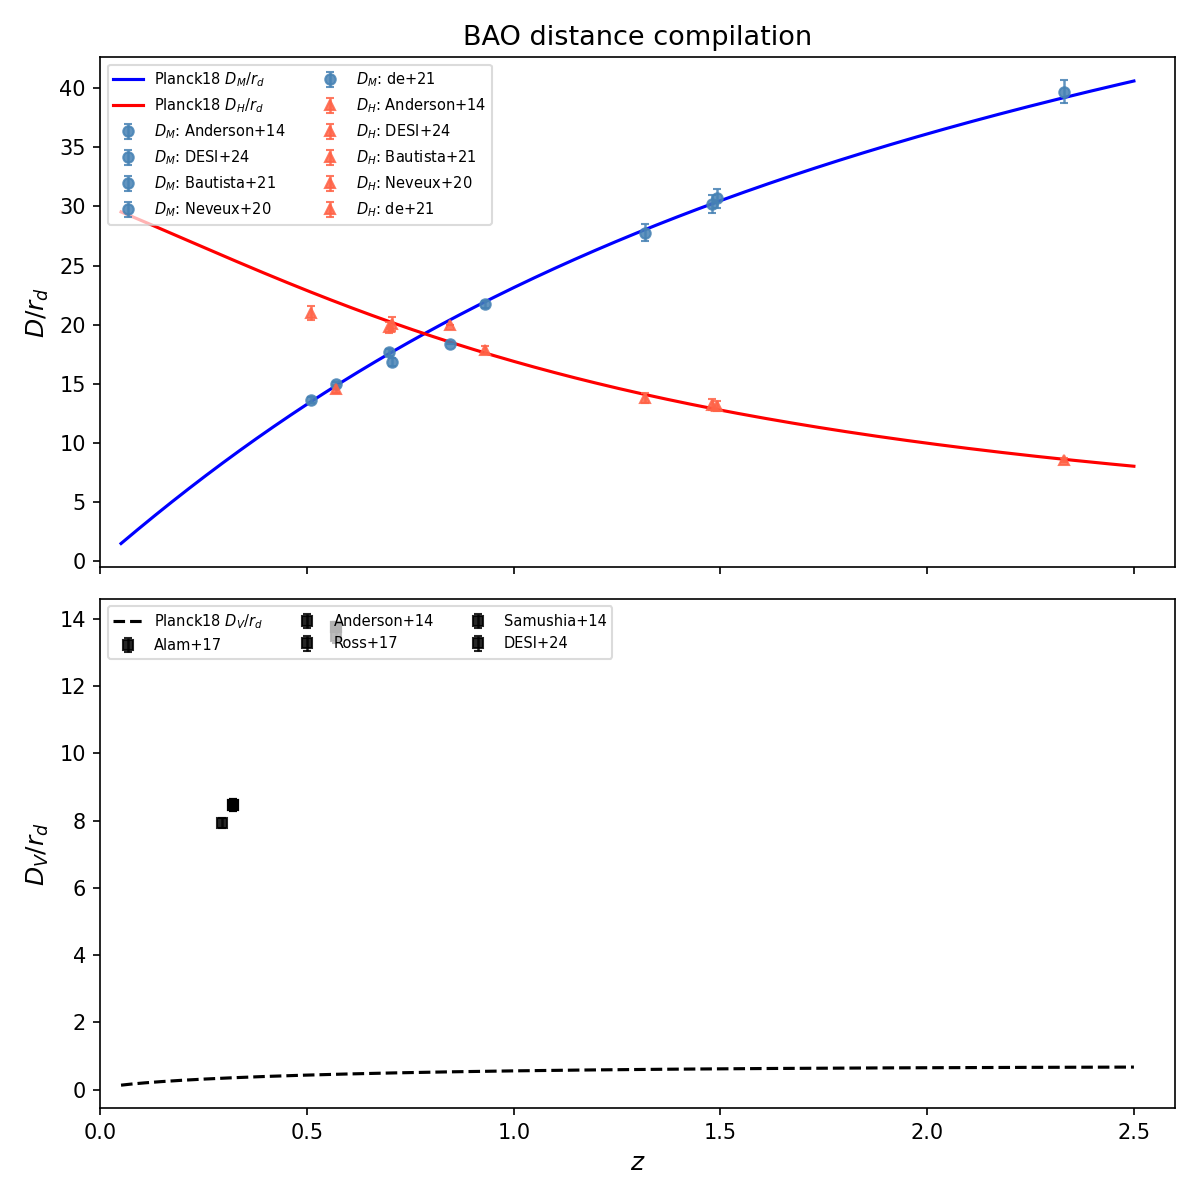
BAO distance ratio D_V/r_d (and D_M/r_d, D_H/r_d) vs redshift from 6dFGS, SDSS, BOSS, eBOSS, and DESI. (Figure will appear here once the figure script has been run.)
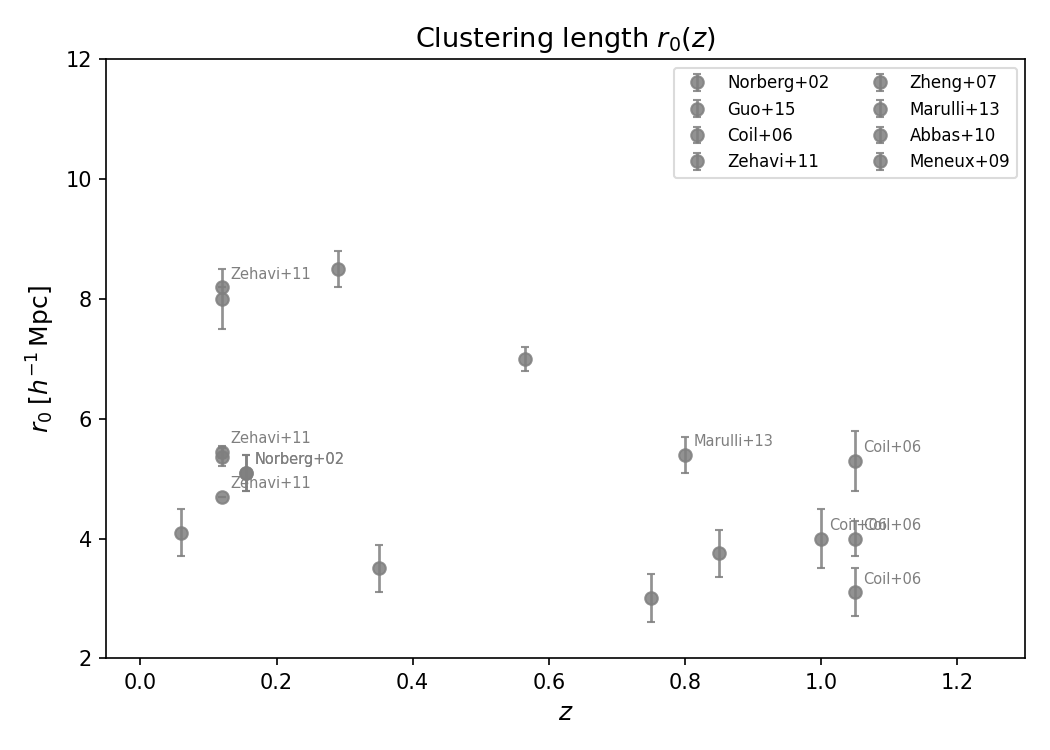
Projected clustering length r₀ vs redshift from wprp measurements spanning 2dFGRS, SDSS, BOSS, VIPERS, and DEEP2.
Projected correlation function wₚ(rₚ)
Thirteen entries measuring the projected two-point correlation function by integrating along the line-of-sight to suppress redshift-space distortions. Several entries (More 2015, More 2023, Zu & Mandelbaum 2015/2016, DESI 2025) include joint wp(rp) + DeltaSigma analyses and appear also in the DeltaSigma section below.
Directory / ID |
Survey |
z range |
Ngal |
Key result |
Cites |
|---|---|---|---|---|---|
SDSS DR7 spec-z |
0.02 – 0.22 |
200 k |
r₀=5.45 h⁻¹ Mpc, γ=1.88; HOD per luminosity bin |
~1200 |
|
2dFGRS spec-z |
0.01 – 0.30 |
96 k |
r₀=5.1 h⁻¹ Mpc; relative bias b/b★ vs luminosity |
~400 |
|
BOSS DR11 LOWZ+CMASS spec-z |
0.15 – 0.70 |
760 k |
r₀=8.5 (LOWZ), 7.0 (CMASS) h⁻¹ Mpc; HOD + SHAM |
~200 |
|
VIPERS PDR-1 spec-z |
0.50 – 1.10 |
31 k |
r₀=5.4 h⁻¹ Mpc, b~1.4 at z~0.8; luminosity dependence |
~130 |
|
VVDS wide+deep spec-z |
0.50 – 1.20 |
7.7 k |
r₀=3.75 h⁻¹ Mpc, γ=1.70 at z~0.7; luminosity dependence |
~100 |
|
zCOSMOS bright 10k spec-z |
0.20 – 1.00 |
10.6 k |
r₀=3.5–3.0 h⁻¹ Mpc (z=0.35–0.85); mass+luminosity dependence |
~170 |
|
DEEP2 spec-z |
0.75 – 1.35 |
11 k |
r₀=4.0 h⁻¹ Mpc, γ=1.65 at z~1; red/blue galaxy split |
~250 |
|
SDSS DR5 spec-z |
0.02 – 0.22 |
170 k |
r₀=5.36 h⁻¹ Mpc, γ=1.84; HOD per luminosity bin; SDSS+DEEP2+COMBO-17 HOD evolution |
~400 |
|
BOSS DR11 x CFHTLenS |
0.16 – 0.70 |
560 k |
Joint wp(rp)+DeltaSigma+abundance HOD; Omega_m=0.310, sigma8=0.785 |
~152 |
|
BOSS DR12 x HSC Y3 |
0.15 – 0.70 |
730 k |
wp(rp) for LOWZ/CMASS/CMASS-ELG; 12 log bins 0.1–60 h⁻¹ Mpc; HSC Y3 3x2pt |
~67 |
|
SDSS DR7 spec-z |
0.02 – 0.30 |
150 k |
iHOD joint wp(rp)+DeltaSigma+SMF; SMHM scatter 0.18–0.22 dex; 4 stellar mass bins |
~186 |
|
SDSS DR7 spec-z |
0.02 – 0.30 |
150 k |
iHOD red/blue split; halo quenching threshold M_h ~ 1.5×10¹² h⁻¹ M☉ |
~130 |
|
DESI DR1 BGS+LRG x HSC/KiDS/DES/SDSS |
0.1 – 0.8 |
— |
First DESI DR1 wp(rp) for BGS and LRG; joint wprp+DeltaSigma measurement |
~12 |
Angular correlation function w(θ)
Three entries measuring the angular two-point correlation function in photometric redshift slices.
Directory / ID |
Survey |
z range |
Ngal |
Key result |
Cites |
|---|---|---|---|---|---|
DES Y1 redMaGiC photo-z |
0.15 – 0.90 |
660 k |
bias b=1.45–2.00 in 5 photo-z bins; DES Y1 3×2pt component |
~600 |
|
DES Y3 MagLim photo-z |
0.20 – 1.05 |
10.7 M |
bias b=1.41–2.07 in 6 photo-z bins; SYSnet systematics; DES Y3 3x2pt |
~110 |
|
SDSS commissioning photo-z |
0.10 – 0.40 |
1.4 M |
A~0.01, δ=0.77; Γ~0.17; scale-dependent bias detected |
~200 |
|
2dFGRS photometric parent |
0.00 – 0.60 |
100 k |
A~0.02, δ=0.70 in 6 photo-z slices; angular BAO hint >2σ |
~200 |
Redshift-space multipoles ξℓ(s)
Thirteen entries measuring the monopole, quadrupole (and hexadecapole) of the two-point correlation function in redshift space, used for RSD and BAO analyses.
Directory / ID |
Survey |
z range |
Ngal |
Key result |
Cites |
|---|---|---|---|---|---|
2dFGRS spec-z |
0.00 – 0.30 |
160 k |
β=0.49±0.09, r₀=5.05 h⁻¹ Mpc, σ_v=506 km/s at z~0.15 |
~1000 |
|
2dFGRS spec-z |
0.00 – 0.30 |
220 k |
β=0.58±0.08 at z~0.17; first precision RSD from spherical harmonics decomposition |
~400 |
|
6dF Galaxy Survey spec-z |
0.00 – 0.25 |
75 k |
BAO DV(z=0.106)/rs=0.336±0.015 (4.5%); lowest-z BAO detection at 2.4σ |
~800 |
|
VVDS spec-z |
0.60 – 1.20 |
11.6 k |
f(z=0.77)=0.91±0.36, β=0.70; first high-z RSD measurement |
~650 |
|
WiggleZ spec-z |
0.10 – 0.90 |
153 k |
fsigma8=0.454, 0.430, 0.418, 0.290 at z=0.22–0.78 |
~700 |
|
BOSS DR11 LOWZ+CMASS spec-z |
0.20 – 0.70 |
690 k |
BAO DV/rd to 2% precision at z=0.32 and z=0.57; anisotropic BAO DM/rd+DH/rd |
~1100 |
|
BOSS DR11 CMASS spec-z |
0.43 – 0.70 |
690 k |
fsigma8=0.441±0.044 at z=0.57; DV/rd=13.50±0.22 |
~600 |
|
BOSS DR12 LOWZ spec-z |
0.15 – 0.43 |
362 k |
BAO DV/rd=8.47±0.17 at z=0.32 from post-reconstruction xi(s); companion to Alam+2017 |
~500 |
|
BOSS DR12 LOWZ+CMASS spec-z |
0.20 – 0.75 |
1.20 M |
fsigma8=0.427 (z=0.32), 0.426 (z=0.57); BAO α⊥, α‖ |
~3000 |
|
eBOSS DR16 LRG spec-z |
0.60 – 1.00 |
175 k |
fsigma8=0.473±0.044 at z=0.698; DM/rd=17.65, DH/rd=19.77 |
~200 |
|
eBOSS DR16 ELG spec-z |
0.60 – 1.10 |
174 k |
fsigma8=0.289±0.096 at z=0.845; DM/rd=18.33, DH/rd=20.0 |
~100 |
|
eBOSS DR16 QSO spec-z |
0.80 – 2.20 |
344 k |
fsigma8=0.462±0.045 at z=1.48; DM/rd=30.21, DH/rd=13.23 |
~150 |
|
DESI DR1 (EDR) BGS+LRG+ELG+QSO+Lyα |
0.10 – 2.33 |
5.7 M |
BAO DM/rd+DH/rd for 7 tracers; BGS(0.295), LRG1–3, ELG1–2, QSO, Lyα |
~1000 |
|
DESI DR1 (Year 1) all tracers |
0.10 – 2.10 |
6.0 M |
Two-point statistics (ξ multipoles + Pk multipoles) for all 6 DESI DR1 tracers; feeds full-shape analysis |
~110 |
Galaxy power spectrum P(k)
Three entries measuring the galaxy power spectrum shape (no multipoles), primarily constraining Ωmh and the BAO scale.
Directory / ID |
Survey |
z range |
Ngal |
Key result |
Cites |
|---|---|---|---|---|---|
SDSS DR1 spec-z |
0.02 – 0.30 |
205 k |
Ω_m·h=0.213±0.023; P(k) shape from first SDSS DR1 data |
~1800 |
|
2dFGRS spec-z |
0.00 – 0.30 |
220 k |
Ω_m·h=0.168±0.016, f_b=0.185±0.046; final 2dFGRS P(k) |
~700 |
|
SDSS DR7 (main+LRG) spec-z |
0.00 – 0.50 |
893 k |
DV(z=0.275)/rs=0.1390±0.0037; BAO at 3.6% precision |
~1500 |
Power spectrum multipoles Pℓ(k)
Six entries using the full-shape power spectrum multipoles P₀+P₂(+P₄) with EFT or TNS models for joint BAO + RSD constraints.
Directory / ID |
Survey |
z range |
Ngal |
Key result |
Cites |
|---|---|---|---|---|---|
BOSS DR12 LOWZ+CMASS spec-z |
0.20 – 0.75 |
1.20 M |
fsigma8=0.497 (z=0.32), 0.422 (z=0.57); P_ℓ + bispectrum |
~350 |
|
BOSS DR12 LOWZ+CMASS spec-z |
0.20 – 0.75 |
1.20 M |
fsigma8=0.396 (z=0.32), 0.417 (z=0.57); P₀+P₂+P₄ TNS model |
~600 |
|
BOSS DR12 LOWZ+CMASS spec-z |
0.20 – 0.75 |
1.20 M |
Ω_m=0.311±0.025, H₀=67.9±1.1, σ₈=0.721±0.043; EFTofLSS |
~400 |
|
BOSS DR12 LOWZ+CMASS spec-z |
0.20 – 0.75 |
1.20 M |
BOSS DR12 P0+P2+B0 EFTofLSS; H₀=69.6, σ₈=0.692, S8=0.751±0.039 |
~279 |
|
DESI DR1 (EDR) LRG+ELG+QSO |
0.40 – 2.10 |
— |
P₀+P₂+P₄ for 4 tracers; ShapeFit + EFTofLSS full-shape |
~500 |
|
DESI DR1 (Year 1) all tracers |
0.10 – 2.10 |
4.7 M |
Full-shape P0+P2+P4; Ω_m=0.296±0.010, H₀=68.63±0.79, σ₈=0.841±0.034 |
~157 |
|
DESI DR1 (Year 1) all tracers |
0.10 – 2.10 |
4.7 M |
Cosmological constraints from full-shape DESI DR1; DESI 2024 VII flagship cosmology paper |
~293 |
Excess surface mass density ΔΣ(R)
These measurements use galaxy–galaxy lensing to measure the excess surface mass density ΔΣ(R) = Σcr γt around spectroscopic lens galaxies. Several analyses combine ΔΣ with wp(rp) for joint HOD or halo model constraints on cosmological parameters (S8, Ωm).
Note
ΔΣ(R) entries that also appear in the wprp section (More 2015, More 2023,
Zu & Mandelbaum 2015/2016, DESI 2025) share the same ADS bibcode and
paper.json with their wprp counterparts — the measurement paper covers
both statistics.
Directory / ID |
Survey |
z range |
Ngal |
Key result |
Cites |
|---|---|---|---|---|---|
SDSS DR4 spec-z |
0.02 – 0.35 |
300 k |
Halo masses M200b for L1–L6 luminosity bins; luminosity–halo mass relation |
~500 |
|
COSMOS (HST ACS) |
0.20 – 1.00 |
120 k |
First joint SMF+DeltaSigma+wp HOD 0.2<z<1.0; SMHM evolution; n_eff~66 arcmin⁻² |
~700 |
|
SDSS DR7 spec-z |
0.02 – 0.30 |
150 k |
DeltaSigma for 4 stellar mass bins; iHOD SMHM scatter 0.18–0.22 dex |
~186 |
|
SDSS DR7 spec-z |
0.02 – 0.30 |
150 k |
DeltaSigma red/blue subsamples; halo quenching threshold M_h ~ 1.5×10¹² h⁻¹ M☉ |
~130 |
|
SDSS DR7 spec-z |
0.02 – 0.20 |
50 k |
Halo mass bimodality: red centrals ~0.5 dex more massive than blue at fixed M★ |
~130 |
|
BOSS DR11 x CFHTLenS |
0.16 – 0.70 |
560 k |
DeltaSigma for BOSS LOWZ+CMASS; HOD fit yields Ω_m=0.310, σ₈=0.785 |
~152 |
|
DES Y1 redMaGiC |
0.15 – 0.90 |
660 k |
DeltaSigma for 5 lens bins × 4 source bins; b=1.45–2.00; DES Y1 3x2pt |
~270 |
|
HSC Y1 x BOSS |
0.15 – 0.70 |
430 k |
DeltaSigma for BOSS LOWZ+CMASS x HSC Y1; S8=0.795+0.049-0.042; ~1.5σ below Planck |
~130 |
|
BOSS DR12 x KiDS-1000 (3x2pt) |
0.15 – 0.75 |
1.0 M |
S8=0.766+0.020-0.014 (~2.7σ below Planck) from BOSS w(θ)+DeltaSigma+KiDS shear |
~600 |
|
KiDS-1000 bright galaxies |
0.10 – 0.90 |
1.0 M |
DeltaSigma for KiDS bright luminosity/stellar mass bins; 0.05–2 Mpc; HOD+wp joint fit |
~60 |
|
DES Y3 redMaGiC |
0.20 – 0.65 |
— |
DES Y3 2x2pt redMaGiC; S8~0.78; 5 lens bins; clustering + galaxy-galaxy lensing |
~116 |
|
DES Y3 MagLim |
0.20 – 1.05 |
10.7 M |
DeltaSigma for 6 MagLim lens bins × 4 source bins; DES Y3 3x2pt S8=0.776 |
~150 |
|
HSC Y3 x BOSS DR12 |
0.15 – 0.70 |
730 k |
DeltaSigma for 3 BOSS lens samples × 4 HSC Y3 source bins; 416 deg²; 12 measurement vectors |
~67 |
|
HSC Y3 x BOSS DR12 |
0.15 – 0.70 |
— |
3x2pt emulator halo model; S8=0.763±0.036 (~2.5σ below Planck) |
~120 |
|
HSC Y3 x BOSS DR12 |
0.15 – 0.70 |
— |
3x2pt perturbation theory minimal bias; S8=0.775+0.043-0.038; consistent with Planck |
~124 |
|
BOSS DR12 x HSC Y3 |
0.15 – 0.70 |
730 k |
DeltaSigma for LOWZ/CMASS/CMASS-ELG x 4 HSC Y3 source bins; 416 deg²; 12 log bins |
~67 |
|
DESI DR1 BGS+LRG x HSC/KiDS/DES/SDSS |
0.1 – 0.8 |
— |
First DESI DR1 DeltaSigma for BGS and LRG; cross-survey consistency of GGL signal |
~12 |
Cosmic shear γγ
Two entries measuring shear–shear (γγ) correlations that appear in the clustering index. For the complete catalogue of Stage-III cosmic shear measurements (10 entries: CFHTLenS, KiDS-450, KiDS-1000, DES Y1/Y3, HSC Y1/Y3) with S8 constraints and shear estimator details, see Cosmic Shear.
Note
These are pure γγ (shear–shear) measurements, not lens–source (galaxy–galaxy lensing). The KiDS_Wright2025 entry is the final KiDS Legacy release (complete survey footprint), giving a notably higher S8 than earlier KiDS releases.
Directory / ID |
Survey |
z range |
Nsrc |
Key result |
Cites |
|---|---|---|---|---|---|
KiDS-1000 shear |
0.1 – 1.2 |
21 M |
S8=0.759+0.024-0.021 (~3σ below Planck); band powers + COSEBIs; companion to Heymans+2021 |
~771 |
|
KiDS-Legacy (final release) |
0.1 – 1.2 |
— |
S8=0.81+0.016-0.021 — notably higher than earlier KiDS releases; consistent with Planck |
~206 |
Summary figures
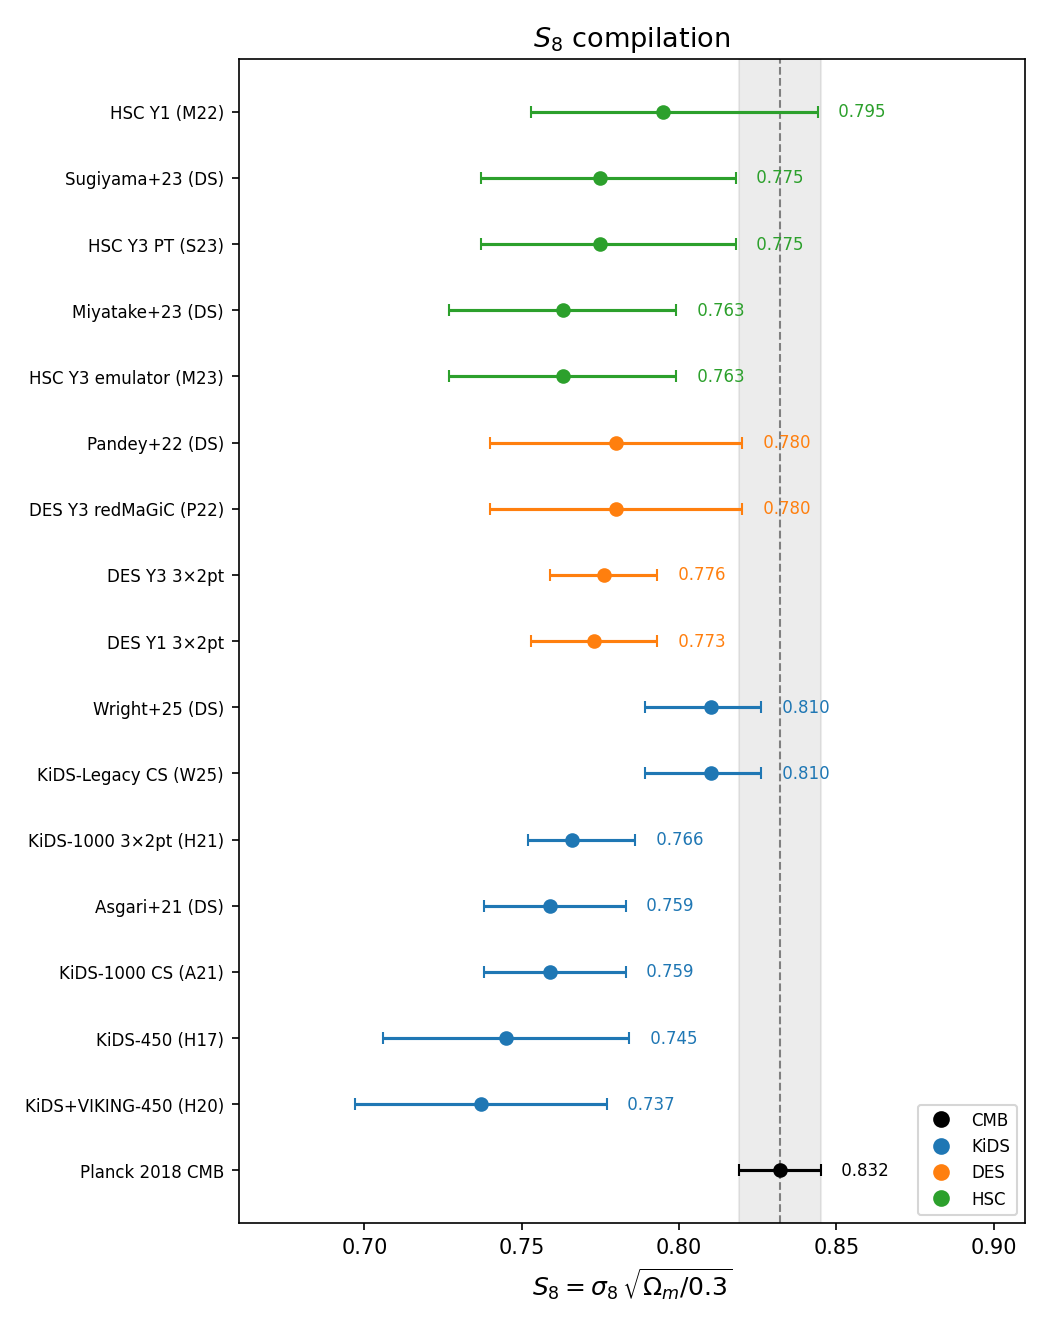
S8 = σ₈(Ω_m/0.3)^0.5 constraints from Stage-III lensing surveys (KiDS, DES, HSC) compared to Planck 2018.