Stellar Mass Functions
Compilation of published galaxy stellar mass function (GSMF) measurements
used as benchmarks for this pipeline. Data live under
literature_measurements/luminosity_function/stellar_mass/ (accessed
through literature_measurements/luminosity_function/index.json) and
literature_measurements/stellar_mass_function/.
IMF convention: All masses are converted to (or already use) a Chabrier (2003) IMF. To convert from Salpeter: subtract 0.21 dex from log₁₀ M★. Kroupa (2001) ≈ Chabrier (±0.03 dex); no correction needed.
FITS data schema: see the standard schema table below.
Measurement methods
Double Schechter function convention
The galaxy SMF is well described at all redshifts by a double Schechter function (two power-law slopes sharing a common characteristic mass M★):
where
M★ (often quoted as log₁₀ M★/M☉) — characteristic stellar mass;
ϕ★₁, ϕ★₂ — normalisation amplitudes (Mpc⁻³ dex⁻¹);
α₁ — faint-end slope for the massive (Gaussian-like) component, typically α₁ ≈ −0.4 to 0;
α₂ — steep low-mass slope, typically α₂ ≈ −1.4 to −1.6.
At high redshift (z > 1) a single Schechter function is often sufficient because the faint-end upturn cannot be constrained.
Note
The parameters φ★₁ and φ★₂ can both be negative in some parameterisations
— what matters is their sum at M★. Always check the convention in
individual paper.json files before combining.
1/Vmax estimator (Schmidt 1968)
The 1/Vmax method estimates the GSMF directly without assuming a parametric form. For a flux-limited survey, the estimator is:
where \(V_{\max,i}\) is the comoving volume within which galaxy \(i\) would remain in the survey (i.e., above the flux limit), and \(w_i\) are completeness weights accounting for spectroscopic incompleteness, k-correction uncertainty, and surface brightness selection effects.
The key assumption is that galaxies are uniformly distributed in space (no clustering correction). In practice this introduces a bias when large voids or overdensities are present within the survey volume; this effect is largest for surveys covering only a few deg² (COSMOS, zCOSMOS) and negligible for wide-area surveys (GAMA, DESI).
References: Schmidt 1968, ApJ 151, 393; Felten 1976, ApJ 207, 700.
STY / maximum-likelihood estimator (Sandage, Tammann & Yahil 1979)
The STY estimator maximises the likelihood that each galaxy is observed at its luminosity/mass given the survey selection function:
where \(\Phi(L, z_i)\) is the selection function (the probability that a galaxy of luminosity L at redshift \(z_i\) enters the survey). The estimator is unbiased by density fluctuations because the normalisation is marginalised out. It requires a parametric model (Schechter function).
References: STY 1979, ApJ 232, 352; Efstathiou, Ellis & Peterson 1988, MNRAS 232, 431.
SWML / non-parametric maximum likelihood (Efstathiou et al. 1988)
The Stepwise Maximum Likelihood (SWML) estimator is the non-parametric extension of the STY method: it estimates φ in discrete bins without assuming any functional form. The solution is obtained iteratively by solving a set of coupled likelihood equations. Because it is unbiased by density fluctuations and non-parametric, it is the preferred method for detecting deviations from a Schechter shape such as the double-power-law turnover at M★ in the local GSMF.
Driver+2022 (GAMA DR4) used SWML in combination with a 1/Vmax check as their primary estimator.
Colour-dependent 1/Vmax (Baldry et al. 2012)
For surveys with broad wavelength coverage, galaxies of different colours (red vs blue, or early-type vs late-type) have significantly different k-corrections at fixed redshift, meaning their effective Vmax differs even at the same observed magnitude. The colour-dependent 1/Vmax method (Baldry+2012) computes separate \(V_{\max,i}\) for each galaxy using its measured colour, accounting for this differential selection. This produces more accurate SMFs for the red and blue populations separately and reduces the bias in the total SMF near the flux limit.
PAC / n̄₂wₚ method (Xu et al. 2025)
The Probability-based Abundance Characterisation (PAC) method, introduced by Xu+2025, does not measure the GSMF from a spectroscopic sample directly. Instead it cross-correlates a sparse spectroscopic tracer sample with a much deeper photometric catalog to infer the projected number density profile:
where the sum is over photometric-spectroscopic pairs and \(\Phi(r_p)\) is the pair count kernel. By integrating wₚ over the photometric sample down to very faint magnitudes (DECaLS, r < 23.5), the method recovers the GSMF to stellar masses as low as 10⁵·³ M☉ — far below the spectroscopic completeness limit of the BGS.
Key advance: PAC extends the effective spectroscopic completeness to the full photometric depth using cross-correlation, and is the primary method used by DESI Y1 to produce the world-best low-redshift GSMF over 7500 deg².
Reference: Xu+2025, arXiv:2503.01948.
Open questions and current status
Low-mass end slope
The faint-end slope α₂ ~ −1.4 to −1.6 is robustly measured above 10⁸·⁵ M☉ by GAMA and SDSS, but uncertainty increases rapidly below this threshold. The dominant systematic is surface brightness incompleteness: low-mass galaxies are often compact, low surface brightness objects whose flux may be underestimated by automated photometry pipelines, leading to a spurious flattening of the observed GSMF. Photometric completeness corrections based on injection-recovery tests are uncertain at the 30–50% level below 10⁸ M☉.
JWST observations with COSMOS-Web (Shuntov+2025) and NIRCam/WFSS (Euclid Consortium, Zalesky+2025) are now pushing below 10⁶–10⁷ M☉ at z < 1 with deep NIR photometry, but cosmic variance (small fields of a few arcmin²) limits the precision. DESI BGS PAC (Xu+2025) provides the largest volume at z < 0.2 over 7500 deg² and is less affected by surface brightness effects because the photometric cross-correlation naturally weights towards the resolved component.
Quiescent fraction and red sequence
The split of the GSMF into star-forming and quiescent populations is a fundamental constraint on quenching models. The total GSMF at z ~ 0 is dominated by star-forming galaxies below 10¹⁰·⁵ M☉ and by quiescent galaxies above 10¹¹ M☉. This bimodality is well described by the double Schechter function with separate normalisation for each component (Baldry+2012; Peng+2010).
The quiescent fraction at fixed stellar mass evolves strongly with redshift: it rises from ~10% at z ~ 2 to ~60% at z ~ 0 for M★ > 10¹¹ M☉. Accurately separating blue and red populations at high redshift requires rest-frame colour information that becomes degenerate with photometric redshift uncertainties in photometric surveys.
High-z evolution and JWST era
The characteristic mass M★ drops weakly with redshift (by ~0.3 dex from z = 0 to z = 2), while the normalisation φ★ drops by ~1 dex over the same range. At z > 3, both parameters are increasingly uncertain due to photometric redshift systematics, cosmic variance in small fields, and contamination from AGN.
JWST has revealed a potential excess of massive galaxies (M★ > 10¹⁰·⁵ M☉) at z > 6–8 relative to predictions from standard ΛCDM galaxy formation models (e.g., Boylan-Kolchin 2023). This tension, sometimes called the “JWST excess”, has stimulated debate about early star formation efficiency, top-heavy IMFs at high z, and black hole co-evolution. However, significant sample-to-sample variance remains between different JWST analyses, attributable partly to photometric redshift systematics and partly to the small fields surveyed.
Cosmic variance
The COSMOS field (2 deg²) subtends only ~30 Mpc at z ~ 0.5, making it susceptible to large-scale structure fluctuations. The GSMF inferred from COSMOS may be biased by 10–20% relative to a fair-sample mean. Cosmic variance corrections using the measured overdensity in the field are applied but carry their own systematic uncertainties.
DESI BGS over 7500 deg² resolves the cosmic variance problem at z < 0.3: at z ~ 0.1 the survey subtends ~900 Gpc³ and the GSMF cosmic variance is < 1%.
IMF uncertainty
The choice of stellar IMF affects the inferred stellar masses at fixed mass-to-light ratio. The Chabrier (2003) and Kroupa (2001) IMFs agree to within ±0.03 dex; the Salpeter (1955) IMF gives stellar masses ~0.21 dex higher. There is growing evidence for IMF variation in massive elliptical galaxies (bottom-heavy IMF, van Dokkum+2010), which would imply stellar masses 0.1–0.3 dex higher than Chabrier-based estimates. This systematic affects the shape of the GSMF high-mass end and the SMHM relation at M★ > 10¹¹ M☉.
Progress over two decades
The table below summarises the key milestones in GSMF measurement:
2003–2004: Bell+2003 and Baldry+2004 publish the first SDSS SMFs with a clear double Schechter shape at z ~ 0. The SDSS DR1 sample (~50k galaxies) establishes the M★ ~ 10¹⁰·⁸ M☉ characteristic mass.
2009–2010: zCOSMOS (Pozzetti+2010) and VVDS push the SMF to z ~ 1 with spectroscopic redshifts. The overall shape is confirmed but the faint-end slope is poorly constrained below 10⁹ M☉ at z > 0.5.
2012: Baldry+2012 (GAMA I, 135 deg², 5.2k galaxies at z < 0.06) provides the best local double Schechter fit. The low-mass upturn (α₂ ~ −1.47) is confirmed with a well-controlled spectroscopic sample. This remains the canonical z ~ 0 benchmark.
2013: COSMOS/UltraVISTA Ilbert+2013 and Muzzin+2013 (both ~150–220k galaxies, z < 4) establish the photometric SMF to high redshift with near-infrared photometry; PRIMUS (Moustakas+2013, 210k prism-z galaxies) provides a wide-area (9 deg²) spectroscopic bridge at z ~ 0.5–1.0.
2014: VIPERS PDR-1 (Fritz+2014, 41k spec-z, 0.5 < z < 1.3) and ZFOURGE (Tomczak+2014, 45k photo-z, z < 3) extend the spectroscopic and photometric benchmarks to intermediate and high redshift.
2017: COSMOS2015 (Davidzon+2017, 155k photo-z) extends the SMF to z ~ 6 using Ks-selected photometry with 30-band photometric redshifts.
2022: GAMA DR4 (Driver+2022, 250k spec-z, z < 0.1, 250 deg²) becomes the best local spectroscopic benchmark with 1/Vmax + SWML and an improved incompleteness treatment.
2023–2025: Three complementary surveys open a new era: COSMOS-Web (Shuntov+2025, JWST, 0.54 deg², z < 5.5) provides the deepest NIR SMF; Euclid DR1 (Zalesky+2025, 2.1M galaxies, z < 6.5) extends photometric coverage over wide area; DESI Y1 BGS PAC (Xu+2025, ~10M galaxies, 7500 deg², z < 0.2) delivers the world-best low-z GSMF.
What was solved: The overall shape of the SMF at 0 < z < 2 is well established; the z ~ 0 normalisation is robust to < 10% from multiple surveys; the double Schechter description is validated across surveys and methods; the existence of the faint-end upturn with slope α₂ ~ −1.4 to −1.6 is secure from GAMA.
What remains open: The GSMF below 10⁷ M☉; the SMF of satellite galaxies at fixed halo mass; the physical origin of M★ (feedback vs. cooling); the high-z (z > 4) GSMF, now accessible only with JWST; the role of IMF variation in the high-mass normalisation.
Survey parameter table
Survey |
Method |
z range |
Area (deg²) |
Ngal |
Veff (Gpc³) |
n̄ (10⁻⁴ Mpc⁻³) |
|---|---|---|---|---|---|---|
GAMA_Baldry2012 |
1/Vmax |
0 – 0.06 |
135 |
5.2 k |
0.001 |
2.5 |
GAMA_Driver2022 |
1/Vmax + SWML |
0 – 0.1 |
250 |
230 k |
0.004 |
57 |
PRIMUS_Moustakas2013 |
1/Vmax + STY |
0.01 – 1.0 |
9 |
210 k |
0.03 |
7 |
zCOSMOS_Pozzetti2010 |
1/Vmax + STY |
0.1 – 1.0 |
1.7 |
11 k |
0.001 |
11 |
VIPERS_Fritz2014 |
1/Vmax + STY |
0.5 – 1.3 |
24 |
41 k |
0.03 |
1.4 |
COSMOS_Ilbert2013 |
1/Vmax + STY |
0.2 – 4.0 |
2 |
220 k |
0.01 |
22 |
COSMOS_Muzzin2013 |
1/Vmax + STY |
0.2 – 4.0 |
1.62 |
154 k |
0.008 |
19 |
COSMOS_Shuntov2025 |
1/Vmax |
0.2 – 5.5 |
0.54 |
300 k |
0.002 |
150 |
DESI_PAC_Xu2025 |
PAC |
0 – 0.2 |
7500 |
~10 M |
0.4 |
250 |
DESI_Vmax_Xu2025 |
1/Vmax |
0 – 0.2 |
7500 |
~10 M |
0.4 |
250 |
Figures
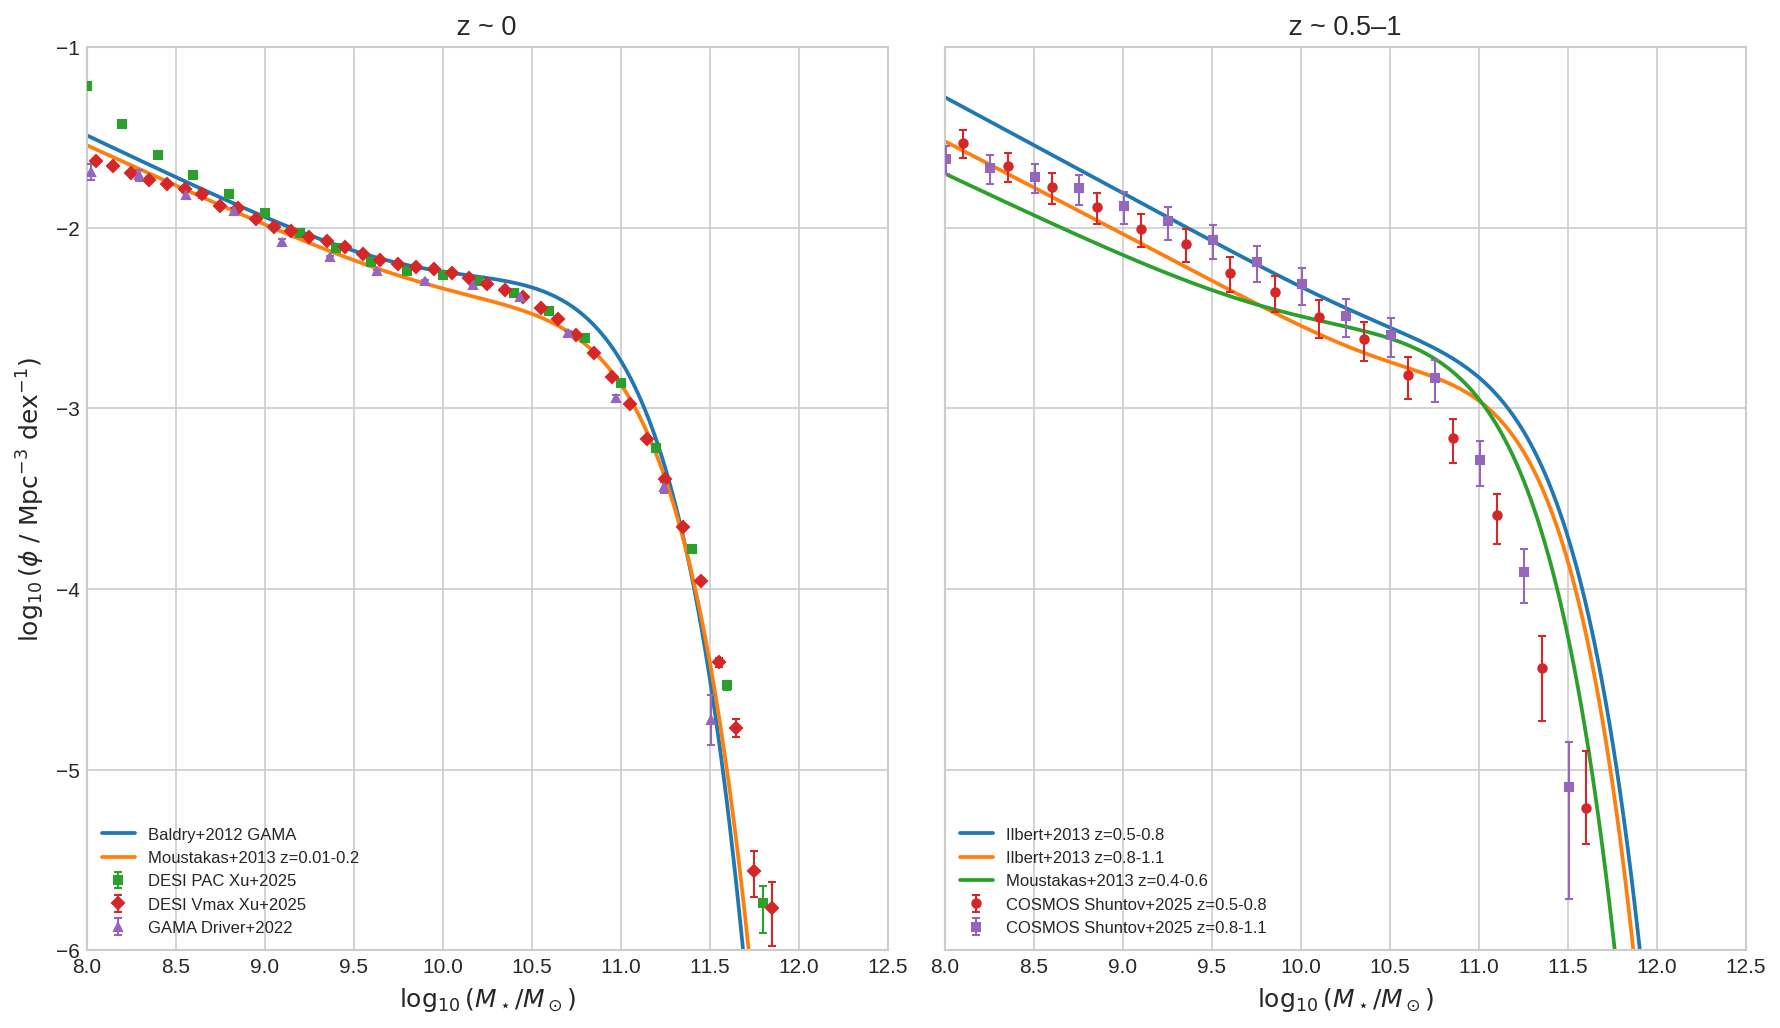
φ(log M★) from all surveys at z ~ 0 (left panel) and z ~ 0.5–1 (right panel). Shaded bands show 1σ uncertainties; vertical dashed line marks the characteristic mass M★ ~ 10¹⁰·⁸ M☉ from GAMA. (Figure will appear here once the figure script has been run.)
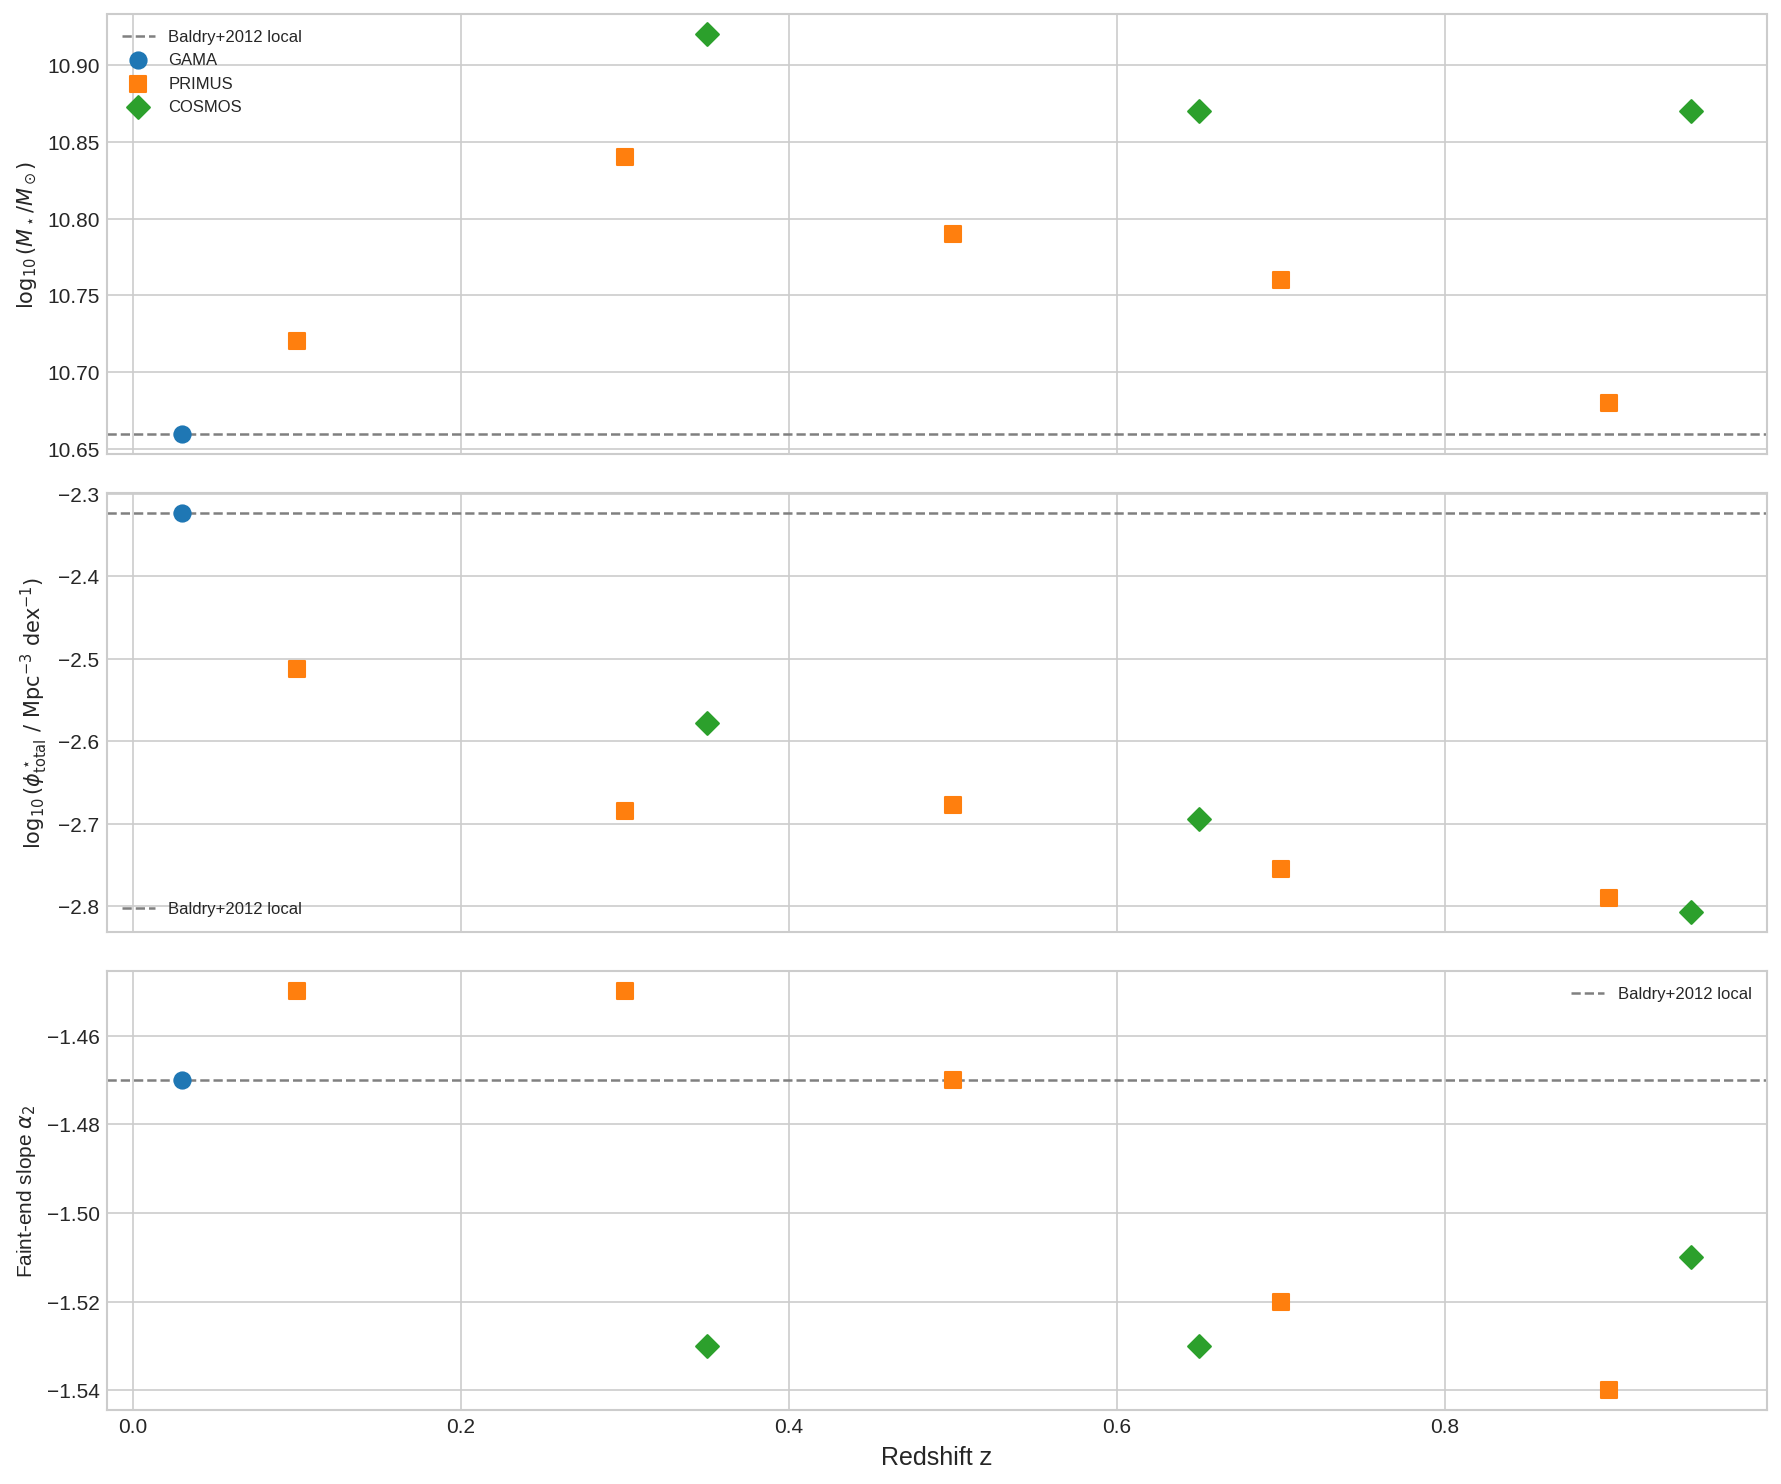
Evolution of double Schechter parameters (log M★, log φ★₁, log φ★₂, α₁, α₂) with redshift from GAMA, COSMOS, ZFOURGE, PRIMUS, and DESI. (Figure will appear here once the figure script has been run.)
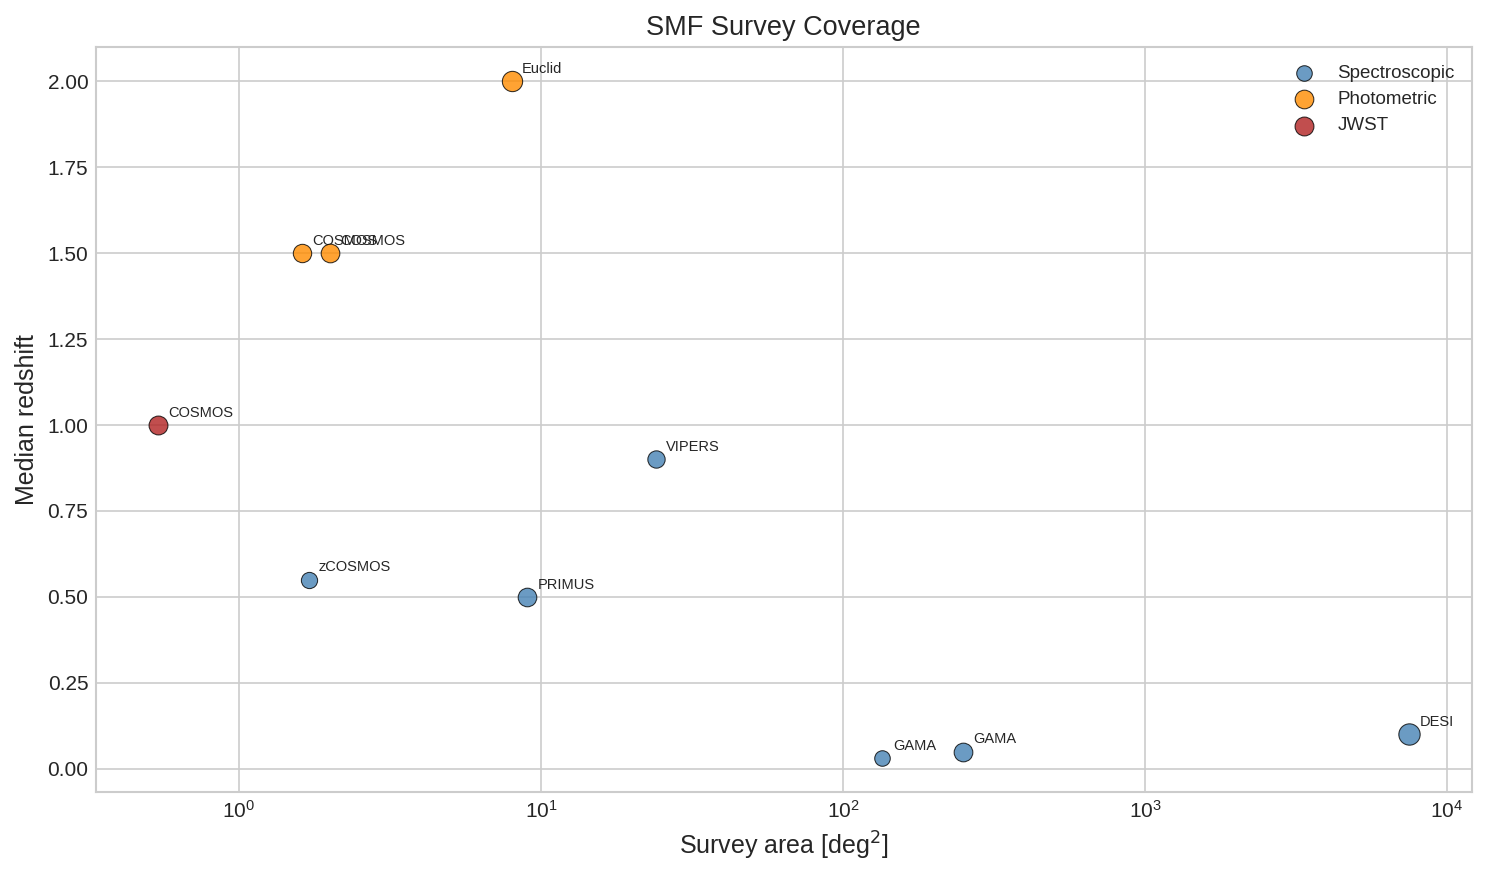
Survey area vs median redshift for all catalogued SMF surveys. Symbol size is proportional to log N_gal; colour indicates method (1/Vmax, STY, PAC). (Figure will appear here once the figure script has been run.)
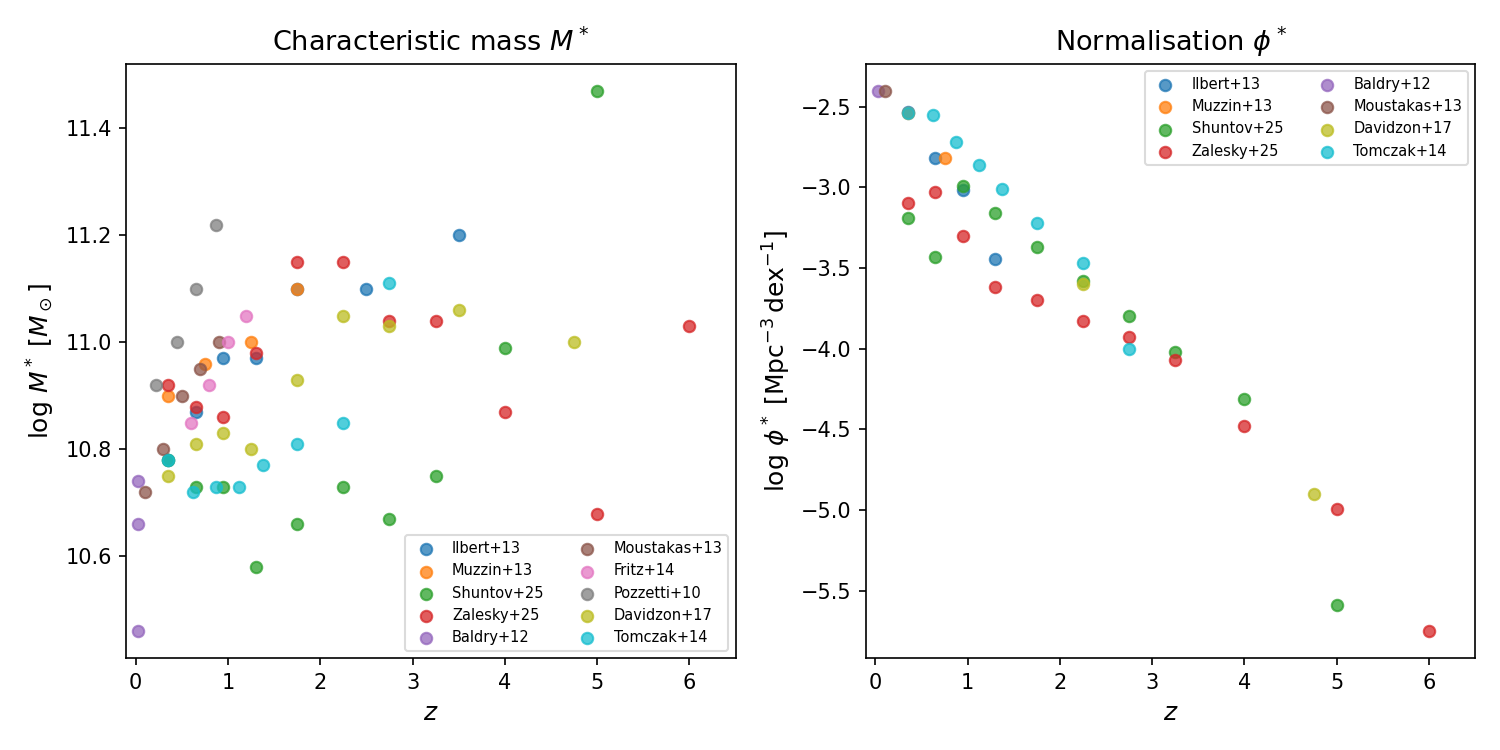
Evolution of Schechter parameters (log M★, ϕ★, α) vs redshift compiled from GAMA, COSMOS, ZFOURGE, and DESI.
All SMF papers — sorted by redshift coverage
Directory / ID |
Survey |
z range |
Ngal |
Form |
Reference |
|---|---|---|---|---|---|
GAMA I spec-z |
0.0 – 0.06 |
5.2 k |
double Schechter |
MNRAS 421, 621 (arXiv:1111.5707) · ~900 cites |
|
ZFOURGE/CANDELS photo-z |
0.2 – 3.0 |
45 k |
double Schechter |
ApJ 783, 85 (arXiv:1309.5972) · ~400 cites |
|
COSMOS2015 photo-z |
0.1 – 6.0 |
155 k |
single/double Schechter per z bin |
A&A 605, A70 (arXiv:1701.02734) · ~400 cites |
|
COSMOS2020 photo-z |
0.0 – 10.0 |
1.7 M |
catalogue paper |
ApJS 258, 11 (arXiv:2110.13168) · ~500 cites |
Note
COSMOS_Weaver2023 is a catalogue paper (the COSMOS2020 photometric
catalogue); the SMF measurements themselves are published in Shuntov+2025
and others using this dataset.
Schechter parameters at z ~ 0 from local surveys
The table below lists double Schechter parameters at z ~ 0 from spectroscopic surveys. All values assume Chabrier (2003) IMF.
Paper |
z ref |
log M★ |
log ϕ★₁ |
α₁ |
log ϕ★₂ |
α₂ |
Note |
|---|---|---|---|---|---|---|---|
0.0 – 0.06 |
10.66 |
−2.40 |
−0.35 |
−3.10 |
−1.47 |
Shared M★; ϕ★ quoted as 3.96e-3 and 0.79e-3 Mpc⁻³ dex⁻¹ |
|
0.2 – 0.5 |
10.78 |
−2.54 |
−0.98 |
−3.69 |
−1.57 |
Lowest-z bin; Chabrier IMF; H₀=70 |
Note
The stellar mass function from GAMA_Baldry2012 is widely used as the
z ~ 0 benchmark. It is based on a highly complete spectroscopic sample
(GAMA I) over 135 deg² and the double Schechter fit has been extensively
validated against mocks.
FITS data files
Entries with tabulated SMF data have smf_*.fits files in the
literature_measurements/stellar_mass_function/ directory.
Directories with FITS data available:
GAMA_Baldry2012— local double Schechter SMFGAMA_Driver2022— GAMA DR4 spec-z SMF (also in LF catalogue)DESI_PAC_Xu2025— DESI Y1 BGS PAC + n̄₂wₚ methodDESI_Vmax_Xu2025— DESI Y1 BGS 1/Vmax SMFCOSMOS_Shuntov2025— COSMOS-Web JWST photo-z (canonical entry with FITS)COSMOS_Shuntov2024— same paper as Shuntov2025; onlypaper.json
Standard FITS column schema
All smf_*.fits files use:
Column |
Unit |
Description |
|---|---|---|
|
dex |
Bin centre, log₁₀(M★/M☉) |
|
dex |
Lower bin edge |
|
dex |
Upper bin edge |
|
Mpc⁻³ dex⁻¹ |
Number density |
|
Mpc⁻³ dex⁻¹ |
Lower 1σ uncertainty |
|
Mpc⁻³ dex⁻¹ |
Upper 1σ uncertainty (NaN for lower limits) |
|
bool |
True for downward-arrow (incomplete) points |