Galaxy Luminosity Functions
Twenty-four published galaxy luminosity function (GLF) measurements
catalogued in literature_measurements/luminosity_function/,
organised by photometric band: r-band (6), B/bJ-band (9), K-band (4),
UV-band (2), and multiband (3). Each entry has a paper.json with
full provenance (survey, method, cosmology, Schechter parameters per
redshift bin and galaxy type).
Conventions: absolute magnitudes quoted as M − 5 log(h) with H₀ = 100 h km s⁻¹ Mpc⁻¹ unless noted; ϕ★ in h³ Mpc⁻³ mag⁻¹; Vega system for K-band, AB for r/B/UV unless noted.
Note
The stellar mass function (SMF) is the closely related observable
in mass units rather than luminosity. See Stellar Mass Functions.
The multiband GAMA_Driver2022 entry appears in both the LF and
SMF catalogues; the LF entry covers panchromatic luminosity functions
while the SMF entry contains the digitised stellar mass function.
Measurement methods
Schechter function in magnitude units
The galaxy luminosity function is well described at all redshifts and bands by a Schechter function (Schechter 1976):
In the more convenient absolute magnitude form:
where
M★ — characteristic absolute magnitude (the “knee”);
ϕ★ — normalisation amplitude [h³ Mpc⁻³ mag⁻¹];
α — faint-end slope (α < −1 gives a rising faint end).
The luminosity density is:
References: Schechter 1976, ApJ 203, 297; Press & Schechter 1974.
K-corrections
Unlike the stellar mass function, the luminosity function requires a K-correction to relate observed broadband photometry to rest-frame absolute magnitudes. The observed apparent magnitude is:
where \(\mu(z) = 5\log_{10}(D_L/10\,\mathrm{pc})\) is the distance modulus and K(z) is the K-correction:
where \(\nu_\mathrm{e} = (1+z)\nu_\mathrm{o}\) and R(ν) is the bandpass response function. K(z) depends on both the galaxy SED type and the band, and must be computed for each galaxy individually.
Standard implementations: kcorrect (Blanton & Roweis 2007, arXiv:astro-ph/0606170) fits a non-negative combination of SED templates to the observed multi-band photometry. Blanton+2003 introduced the “z = 0.1 reference frame” (denoting bands as 0.1r, etc.) to minimise K-correction uncertainties for SDSS samples centred at z ~ 0.1.
Assumptions:
Passband response R(ν) is known accurately (calibration + atmosphere).
Galaxy SED can be approximated by a linear combination of templates.
K-correction uncertainty propagates to Φ(M) at the 0.02–0.05 mag level for z < 0.3, growing to ~0.1 mag at z ~ 1.
1/Vmax estimator
For a flux-limited survey with apparent magnitude limit mlim:
where \(V_{\max,i}\) is the comoving volume within which galaxy \(i\) (with absolute magnitude Mi) would remain above the flux limit: \(m(z_{\max,i}) = m_\mathrm{lim}\). Weights \(w_i\) account for spectroscopic completeness and k-correction uncertainty.
The key assumption is spatial homogeneity; large-scale structure biases the estimate when survey volumes are small (VVDS, DEEP2, GOODS).
STY maximum-likelihood estimator
The STY estimator (Sandage, Tammann & Yahil 1979) maximises the likelihood that each galaxy is observed at its luminosity given the selection function. It is unbiased by density fluctuations but assumes a parametric form (Schechter function):
SWML / non-parametric extension
The Stepwise Maximum Likelihood (SWML) estimator (Efstathiou, Ellis & Peterson 1988) is the non-parametric extension of STY. It estimates Φ in discrete magnitude bins without assuming a Schechter shape, enabling detection of the turnover at M★ or departures from a power law at the faint end. All three estimators are unbiased by density fluctuations; 1/Vmax is sensitive to clustering but is the most commonly reported form.
Open questions and current status
Faint-end slope and completeness
The faint-end slope α is robustly measured at α ~ −1.0 to −1.3 in r-band and B-band locally. The principal uncertainty is surface brightness incompleteness: low-surface-brightness dwarf galaxies (M > −14 in r-band) are missed by automated photometry pipelines, causing the observed LF to flatten below the completeness limit. Correcting for incompleteness at Mr > −14 requires injection- recovery tests with 20–50% uncertainties.
Luminosity evolution and M★(z)
M★ brightens with look-back time in all bands (passive + star-formation evolution). In rest-frame B/r-band, M★ brightens by ~0.5–1.0 mag from z = 0 to z = 1. The slope of this evolution depends on the sample selection (early-type vs late-type) and the IMF. At z > 1 the brightening slows as star formation rates peak at z ~ 2–3.
In rest-frame K-band, M★ is approximately constant with redshift out to z ~ 2 (stellar mass dominated), making K-band LF a better proxy for the stellar mass function. The UV LF traces the instantaneous star formation rate and evolves strongly by ~2 mag in M★ from z = 0 to z = 4.
Colour-type decomposition
The total LF is the sum of red (early-type, passive) and blue (late-type, star-forming) populations. These have systematically different α and M★: red galaxies have a steeper bright end; blue galaxies contribute the faint-end upturn. The evolution of each sub-population is distinct. Accurately separating populations at high redshift requires rest-frame colour information that becomes degenerate with photo-z uncertainties.
Cosmic variance
VVDS, DEEP2, and FORS Deep Field cover only 1–10 deg², subtending 50–100 Mpc at z ~ 0.5–1. The LF inferred from such fields is biased by 5–20% relative to the fair-sample mean. GAMA and SDSS resolve this at z < 0.3; VIPERS resolves it at z ~ 0.5–1.2 over 24 deg².
High-redshift UV LF (z > 3)
The rest-frame UV LF at z > 3 is now measured to M_UV ~ −13 by HST deep fields and JWST. The faint-end slope steepens to α ~ −2 at z > 5. This steep UV LF is a key input to reionisation models (ionising photon budget). JWST is extending measurements to even fainter luminosities and higher redshifts, with significant sample-to-sample variance remaining between different analyses.
Progress over two decades
2001–2002: Cole+2001 (2dFGRS+2MASS K-band) and Norberg+2002 (2dFGRS bJ-band) establish the local LF from the largest redshift surveys of the era (~10–100k galaxies). The Schechter shape is confirmed; M★(K) ~ −23.4 at z ~ 0.05.
2003: Blanton+2003 (SDSS DR1, ~148k galaxies) introduces the K-corrected 0.1r-band convention and produces the first precise SDSS LF with red/blue sub-samples. Becomes the canonical local r-band benchmark.
2005–2006: VVDS (Ilbert+2005) and DEEP2 (Willmer+2006) push the B-band LF to z ~ 1.5 and z ~ 1.35 respectively with spectroscopic redshifts. The first clear evidence for ~0.5–1 mag brightening of M★ with look-back time.
2008–2009: SDSS DR6 (MonteroDorta+2009, 321k galaxies) refines the r-band LF; zCOSMOS (Zucca+2009, 10k galaxies, z < 1) and VVDS (Cucciati+2012, UV LF) extend to higher redshift.
2012–2015: GAMA I (Loveday+2012, 16k galaxies) and GAMA II (Loveday+2015, 180k galaxies) produce multi-band LFs in ugrizYJHK with well-controlled completeness. PRIMUS (Cool+2012, 40k galaxies, 9 deg²) bridges z = 0.2–1 in r-band.
2013–2016: VIPERS PDR-1/PDR-2 (Davidzon+2013/2016, 54–72k galaxies, z = 0.45–1.3) delivers the B-band LF at z ~ 1 from a large spectroscopic survey. FDF (Gabasch+2004) and GOODS (Dahlen+2005) extend to z ~ 5 via photometric redshifts.
2017: GAMA DR3 (Wright+2017, 221k galaxies) produces the final panchromatic LF (FUV–MIR, 21 bands) establishing the energy output of the z < 0.65 Universe.
2022: GAMA DR4 (Driver+2022, 300k galaxies) refines the local LF to z ~ 0.65 across all bands, including the deepest spectroscopic completeness correction to date.
What was solved: The overall shape and normalisation of the LF at 0 < z < 1 is well established across all major bands; the Schechter parameterisation is validated; the luminosity density ρL(z) evolution is traced to z ~ 4 in UV.
What remains open: The faint end at M > −14 (below SDSS completeness); the LF at z > 2 in rest-frame optical; the role of environment (cluster vs field) in LF shape; the connection between LF evolution and star formation quenching.
Survey parameter table
Survey |
Band |
z range |
Area (deg²) |
Ngal |
Veff (h⁻³ Gpc³) |
Reference |
|---|---|---|---|---|---|---|
SDSS_Blanton2003 |
r (0.1r) |
0.02 – 0.22 |
2627 |
148 k |
0.1 |
ApJ 592, 819 |
SDSS_MonteroDorta2009 |
r |
0.005 – 0.25 |
7000 |
321 k |
0.5 |
MNRAS 399, 1106 |
GAMA_Loveday2012 |
r |
0.002 – 0.5 |
135 |
15.7 k |
0.008 |
MNRAS 420, 1239 |
GAMA_Loveday2015 |
ugrizYJHK |
0.002 – 0.5 |
180 |
180 k |
0.01 |
MNRAS 451, 1540 |
PRIMUS_Cool2012 |
r |
0.2 – 1.0 |
9 |
40 k |
0.03 |
ApJ 748, 10 |
2dFGRS_Norberg2002 |
bJ (B) |
0.002 – 0.30 |
1500 |
111 k |
0.04 |
MNRAS 336, 907 |
VVDS_Ilbert2005 |
B |
0.05 – 1.5 |
0.6 |
11.6 k |
0.004 |
A&A 439, 863 |
DEEP2_Willmer2006 |
B |
0.2 – 1.35 |
3 |
11 k |
0.01 |
ApJ 647, 853 |
VIPERS_Davidzon2016 |
B |
0.5 – 1.3 |
24 |
72 k |
0.05 |
A&A 586, A23 |
FDF_Gabasch2004 |
B |
0.5 – 5.0 |
0.04 |
5.5 k |
0.001 |
A&A 421, 41 |
2dFGRS_Cole2001 |
K |
0.0 – 0.2 |
1500 |
17 k |
0.02 |
MNRAS 326, 255 |
2MASS_Kochanek2001 |
K |
0.0 – 0.1 |
20000 |
4.2 k |
0.002 |
ApJ 560, 566 |
VVDS_Cucciati2012 |
FUV (1500 Å) |
0.05 – 4.5 |
1 |
11 k |
0.005 |
A&A 539, A31 |
GAMA_Driver2022 |
FUV–MIR (21) |
0.002 – 0.65 |
250 |
300 k |
0.03 |
MNRAS 513, 439 |
Figures
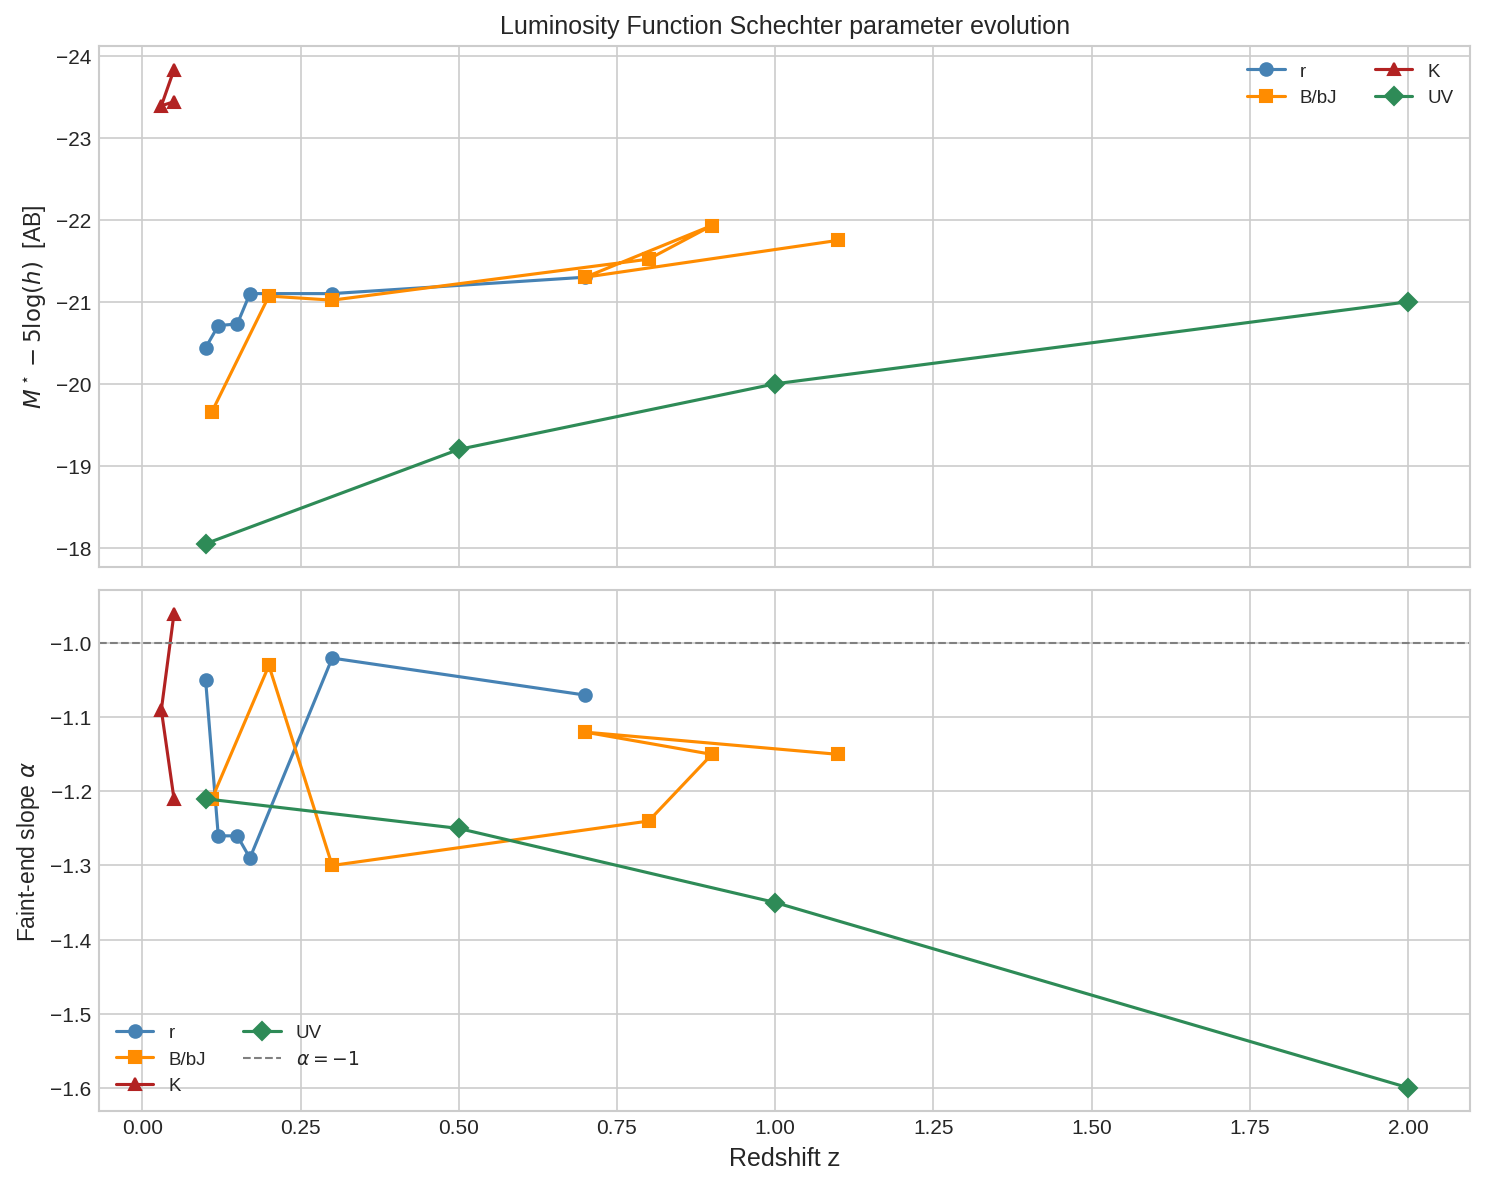
Evolution of M★ (top) and faint-end slope α (bottom) with redshift for r-band (blue), B/bJ-band (orange), K-band (red), and UV (green). K-band M★ is approximately constant with redshift (stellar mass dominated); UV α steepens to ~ −1.6 at z > 1.
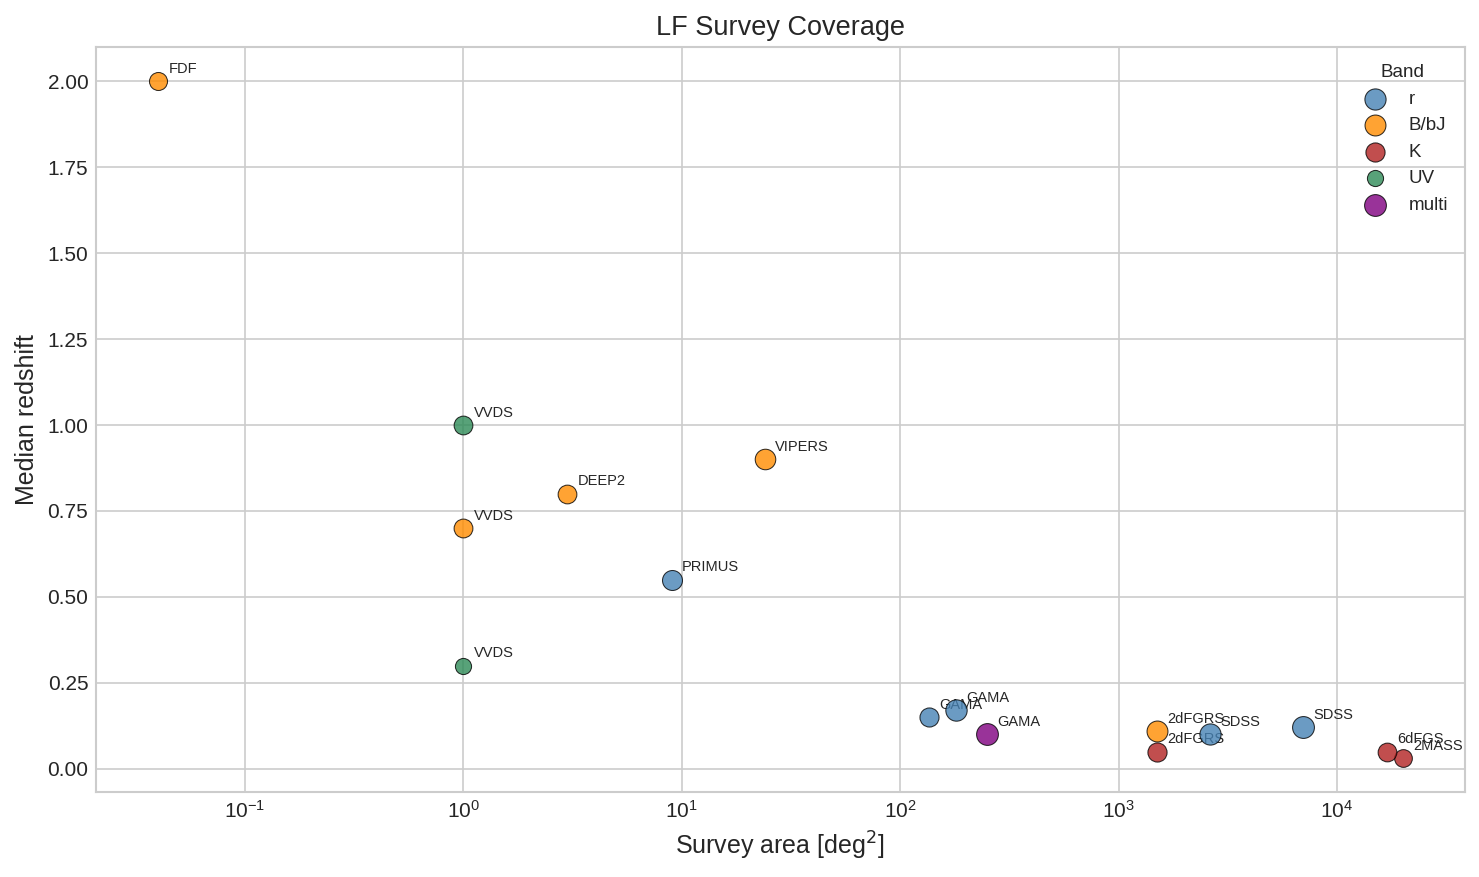
Survey area vs median redshift for all catalogued LF surveys, coloured by band. Symbol size is proportional to log N_gal. Note the large spread in area-redshift coverage: 2MASS covers 20 000 deg² but only z < 0.1; FORS Deep Field covers 0.04 deg² but reaches z ~ 5.
Schechter parameters at z ~ 0 by band
Survey |
Band |
M★ − 5log(h) |
ϕ★ (10⁻² h³ Mpc⁻³) |
α |
Note |
|---|---|---|---|---|---|
0.1r (AB) |
−20.44 |
1.49 |
−1.05 |
z ref = 0.1 frame; STY |
|
r (AB) |
−20.71 |
1.08 |
−1.26 |
SDSS DR6; deeper sample |
|
bJ (Vega) |
−19.66 |
1.61 |
−1.21 |
2dFGRS; M* as M*−5log(h) |
|
Ks (Vega) |
−23.44 |
1.08 |
−0.96 |
2dFGRS+2MASS; low α typical of K-band |
|
Ks (Vega) |
−23.39 |
1.16 |
−1.09 |
2MASS extended source catalog |
|
FUV 1500 Å (AB) |
−18.05 |
1.55 |
−1.21 |
GALEX+VVDS; z = 0–0.2 |
r-band
Rest-frame r-band (~6200 Å).
Directory / ID |
Survey |
z range |
Ngal |
Cites |
Reference |
|---|---|---|---|---|---|
SDSS spec-z |
0.02 – 0.22 |
148 k |
~985 |
ApJ 592, 819 (arXiv:astro-ph/0210215) |
|
SDSS DR6 spec-z |
0.005 – 0.25 |
321 k |
~350 |
MNRAS 399, 1106 (arXiv:0806.4930) |
|
GAMA I spec-z |
0.002 – 0.5 |
15.7 k |
~340 |
MNRAS 420, 1239 (arXiv:1111.0166) |
|
GAMA II spec-z |
0.002 – 0.5 |
180 k |
~150 |
MNRAS 451, 1540 (arXiv:1505.01003) |
|
GAMA II spec-z |
0.04 – 0.26 |
50 k |
~120 |
MNRAS 445, 2125 (arXiv:1404.3748) |
|
PRIMUS prism-z |
0.2 – 1.0 |
40 k |
~230 |
ApJ 748, 10 (arXiv:1108.4933) |
B/bJ-band
Rest-frame B-band (~4400 Å) / bJ-band.
Directory / ID |
Survey |
z range |
Ngal |
Cites |
Reference |
|---|---|---|---|---|---|
2dFGRS spec-z |
0.002 – 0.30 |
111 k |
~800 |
MNRAS 336, 907 (arXiv:astro-ph/0111011) |
|
VVDS spec-z |
0.05 – 1.5 |
11.6 k |
~500 |
A&A 439, 863 (arXiv:astro-ph/0409133) |
|
VVDS spec-z |
0.05 – 1.5 |
11.6 k |
~280 |
A&A 455, 879 (arXiv:astro-ph/0606371) |
|
DEEP2 spec-z |
0.2 – 1.35 |
11 k |
~560 |
ApJ 647, 853 (arXiv:astro-ph/0506041) |
|
FORS Deep Field photo-z |
0.5 – 5.0 |
5.5 k |
~240 |
A&A 421, 41 (arXiv:astro-ph/0312089) |
|
GOODS spec+photo-z |
0.0 – 2.0 |
5 k |
~330 |
ApJ 631, 126 (arXiv:astro-ph/0507005) |
|
zCOSMOS spec-z |
0.1 – 1.0 |
10.6 k |
~200 |
A&A 508, 1217 (arXiv:0904.3621) |
|
VIPERS PDR-1 spec-z |
0.45 – 1.1 |
54 k |
~130 |
A&A 558, A23 (arXiv:1305.2745) |
|
VIPERS PDR-2 spec-z |
0.5 – 1.3 |
72 k |
~110 |
A&A 586, A23 (arXiv:1511.05146) |
K-band
Near-infrared Ks-band (~2.2 μm).
Directory / ID |
Survey |
z range |
Ngal |
Cites |
Reference |
|---|---|---|---|---|---|
2dFGRS+2MASS spec-z |
0.0 – 0.20 |
17 k |
~1100 |
MNRAS 326, 255 (arXiv:astro-ph/0012429) |
|
2MASS spec-z (extended) |
0.0 – 0.10 |
4.2 k |
~700 |
ApJ 560, 566 (arXiv:astro-ph/0011456) |
|
6dFGS spec-z |
0.0 – 0.15 |
11 k |
~300 |
MNRAS 369, 25 (arXiv:astro-ph/0603015) |
|
VVDS spec-z |
0.2 – 1.0 |
8 k |
~130 |
MNRAS 395, 1591 (arXiv:0903.0383) |
UV-band
Rest-frame FUV (~1500 Å).
Directory / ID |
Survey |
z range |
Ngal |
Cites |
Reference |
|---|---|---|---|---|---|
GALEX + VVDS spec-z |
0.0 – 1.2 |
1 k |
~400 |
ApJ 619, L43 (arXiv:astro-ph/0412525) |
|
VVDS spec-z |
0.05 – 4.5 |
11 k |
~280 |
A&A 539, A31 (arXiv:1109.1828) |
Multiband (panchromatic)
Panchromatic LF across many bands simultaneously (FUV to MIR).
Directory / ID |
Survey |
z range |
Ngal |
Cites |
Reference |
|---|---|---|---|---|---|
GAMA spec-z (21 bands) |
0.013 – 0.10 |
104 k |
~350 |
MNRAS 422, 1527 (arXiv:1204.1508) |
|
GAMA DR3 spec-z (21 bands) |
0.002 – 0.65 |
221 k |
~160 |
MNRAS 470, 283 (arXiv:1702.04713) |
|
GAMA DR4 spec-z (21 bands) |
0.002 – 0.65 |
300 k |
~120 |
MNRAS 513, 439 (arXiv:2201.07439) |
Note
GAMA_Driver2022 also appears in the Stellar Mass Functions catalogue.
The LF entry covers panchromatic luminosity functions; the SMF entry
contains the digitised stellar mass function data files.